
Aerospace & Defense .svg)
Aerospace and Defense companies have historically struggled with industrial productivity. Cost-plus government contracts, manual processes, disconnects between engineering and operations, complex products, and a move to lifecycle services have all hampered performance.
Demand surged through 2025 with record commercial backlogs and growing defense procurement, but the productivity response has split sharply by tier. Tier-1 suppliers in propulsion and structural are scaling with the cycle, and Rolls-Royce, GE Aerospace, Howmet, and TransDigm all rank among the World’s Most Productive Companies. The Major OEMs and Defense Contractors have not matched that production ramp. Backlogs are climbing faster than revenue, and the investments in digital twin, digital thread, and new operating models still need to translate into output.
Industry Details
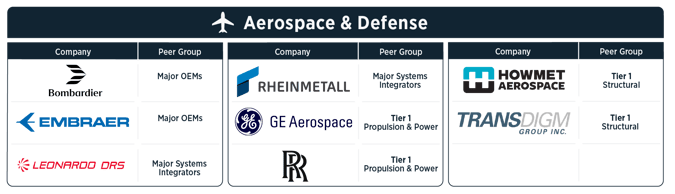
The Aerospace and Defense companies were grouped based on production focus, ranging from OEM providers (aircraft, shipbuilding) to suppliers of control systems, engines, and defense systems. We also accounted for certain diversified companies with footprints in multiple categories: Aircraft; Defense and military systems (armored vehicles, ships and boats, weapon systems, etc.); and Aircraft parts (control systems, engines, and components, etc.). Thirty companies are included in the A&D Index.
Aerospace & Defense Peer Groups
Key Industry Productivity Statistics: Aerospace & Defense
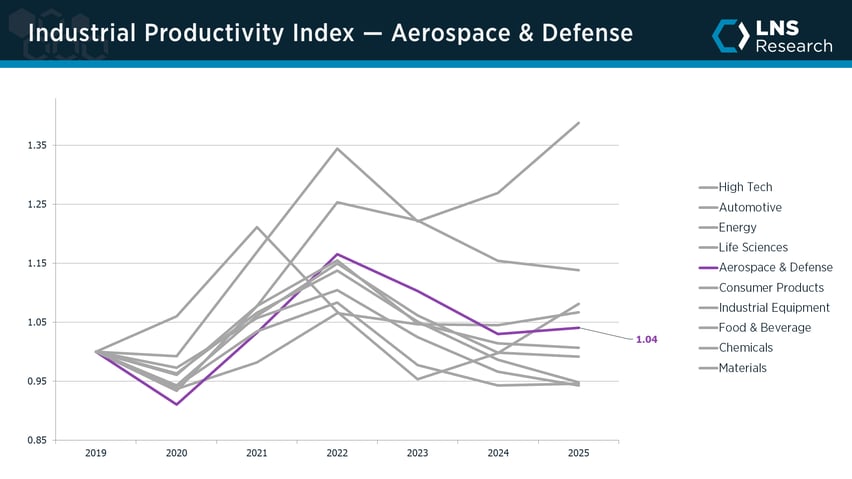
- Aerospace and Defense ranks fifth of ten industries for industrial productivity in 2025, at a revenue-weighted score of 1.04.
- The industry is positive, but trailing where the demand cycle should put it.
- Last year the industry grew productivity by 1.0%. 12 of 30 A&D companies improved in 2025; 18 declined.
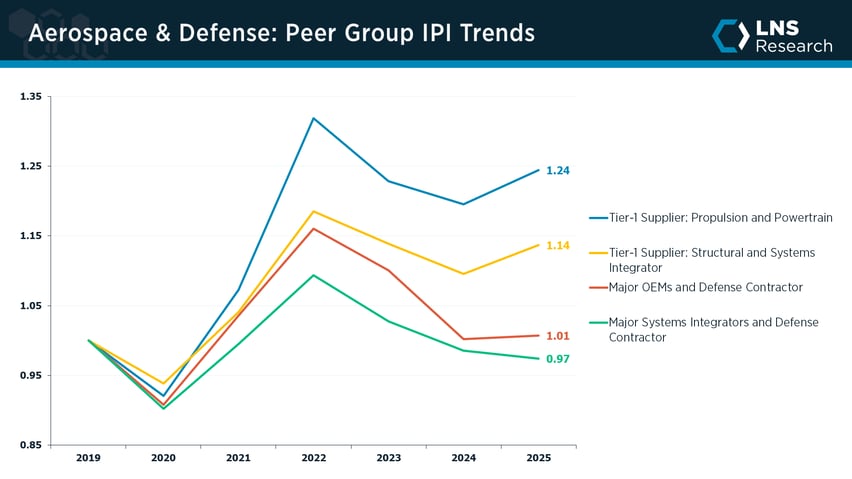
- Growth is concentrated in the Tier-1 suppliers: propulsion ended 2025 at 1.24 and structural at 1.14, both well above the 2019 baseline.
- The Major OEMs (1.01) and Major Systems Integrators (0.97) sit at or below 2019 levels. Backlogs at Boeing, Airbus, and the major defense primes are growing faster than they can convert to output.
- Across the full 2019–2025 window, A&D has gained only 4% in productivity. The industry rebounded to 1.17 by 2022 and gave most of that back by 2024, but in 2025 the decline stopped and modestly reversed.
Aerospace & Defense World's Most Productive Companies

Automotive .svg)
Automotive companies have historically been top industrial productivity performers. A long tradition of pioneering new manufacturing production processes and an early embrace of Lean manufacturing operating models – based on the principles of the Toyota Production System – have all yielded significant results.
Since 2020 that success has continued, and Automotive remains the #2 most productive industry in 2025. Operating model innovation and deeper supplier collaboration have driven significant productivity improvements across the sector. But the retreat from the 2022 peak has not stopped. Many of the major OEMs misread customer demand, misforecast the move to electric vehicles, and over-invested without sufficient capital discipline. Industry productivity fell another 1.4% in 2025; Stellantis posted a 14.5% drop, and even peer-group leaders like Kia and BYD gave back ground. The bright spots are in commercial trucks and specialty suppliers, where PACCAR, Isuzu, and Dorman Products held their gains.
Industry Details
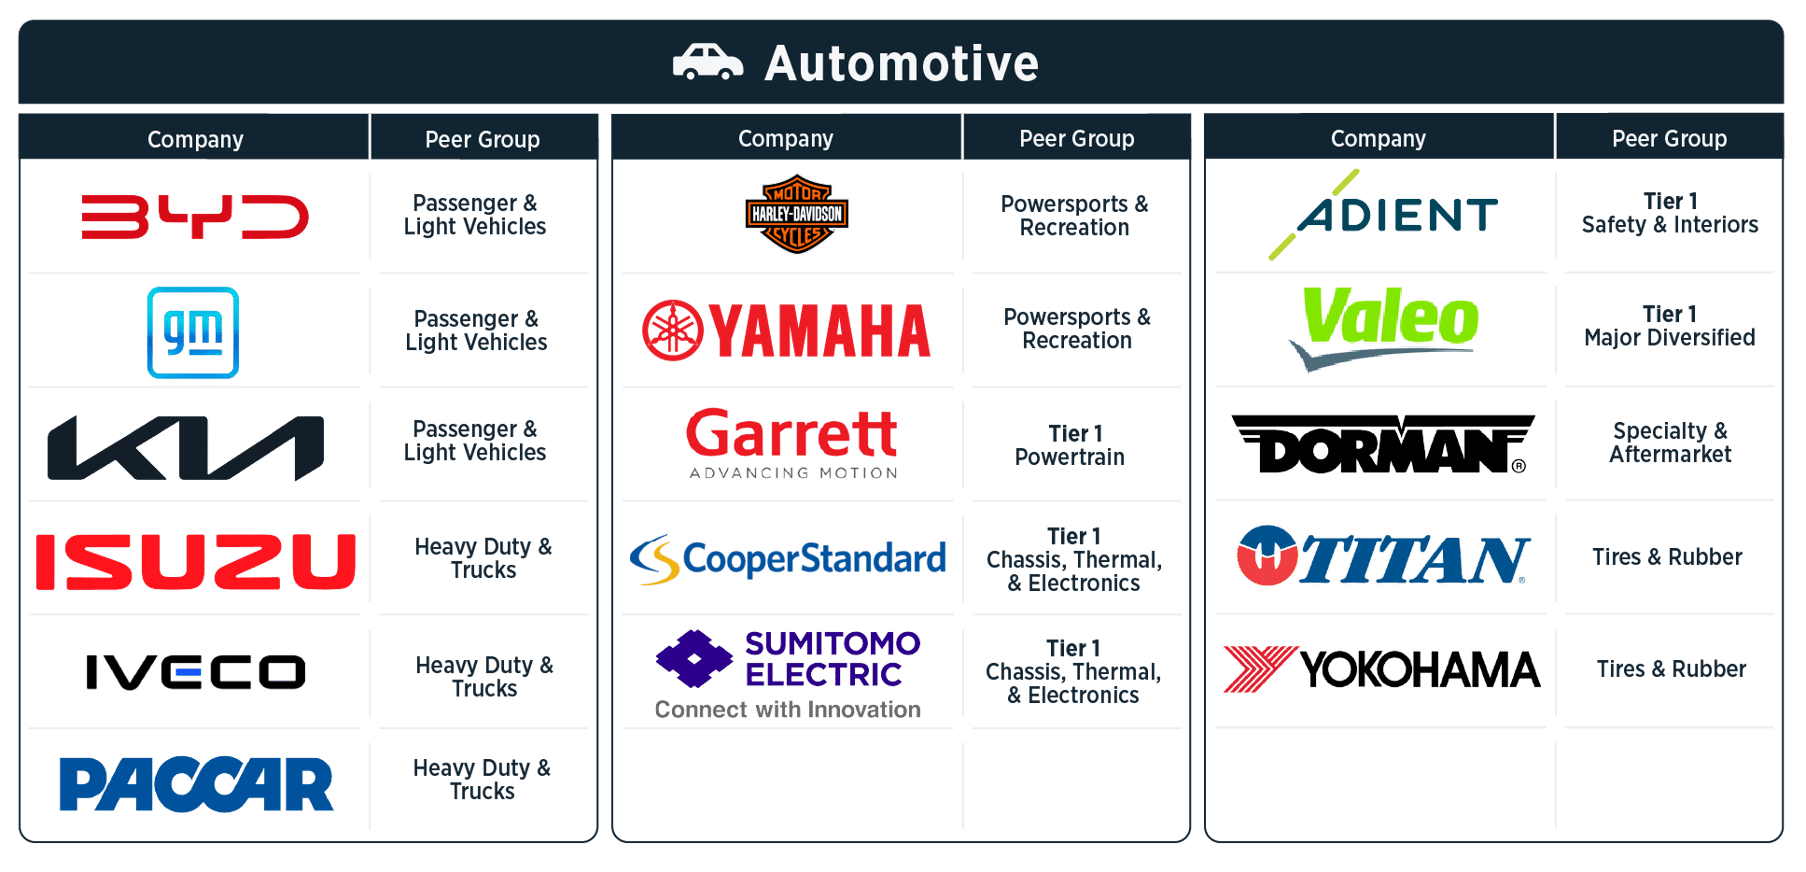
The Automotive sector was split by vehicle types (electric, gas-powered, heavy duty) and a wide range of suppliers differentiated by components, like powertrains, interiors, exteriors, electronics, and tires: Electric vehicles; Gas-powered vehicles; Heavy-duty and motorcycles; Aftermarket parts; Electrical and electronics components; Exterior and chassis components; Interiors; Powertrain and transmission; and Tires. Sixty-four companies were included in the Automotive Index.
Automotive Peer Groups
Key Industry Productivity Statistics: Automotive
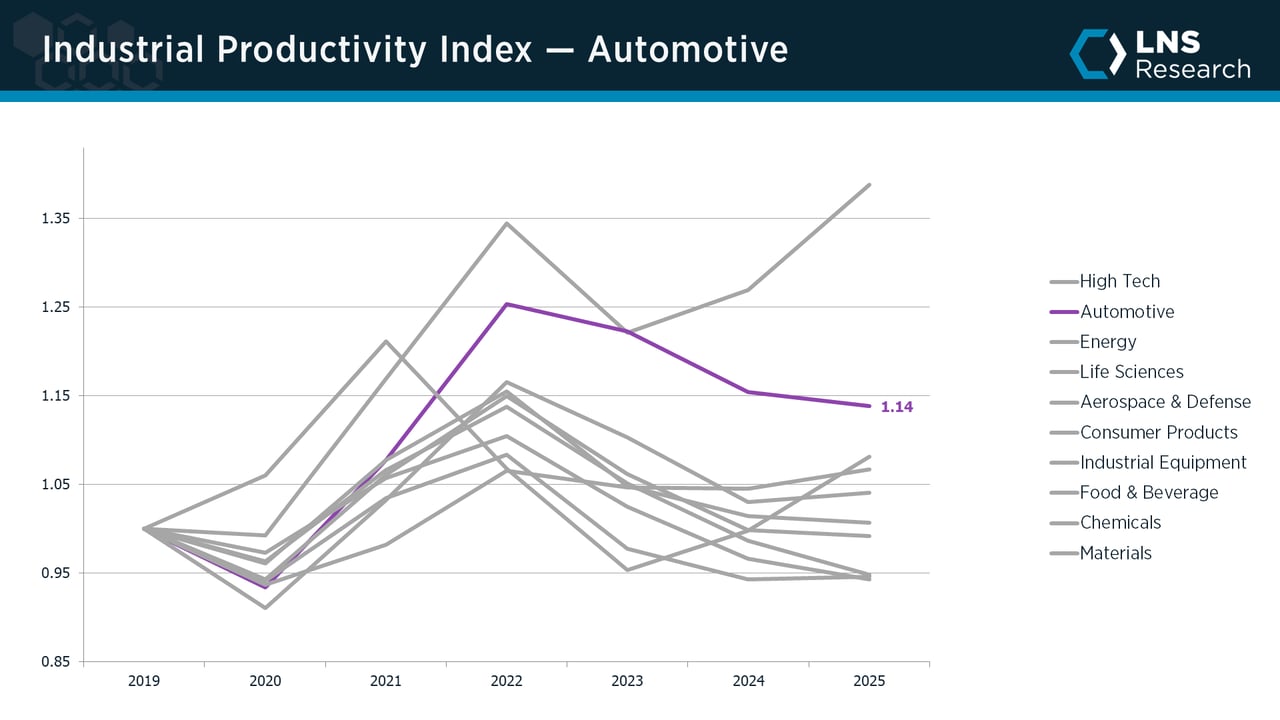
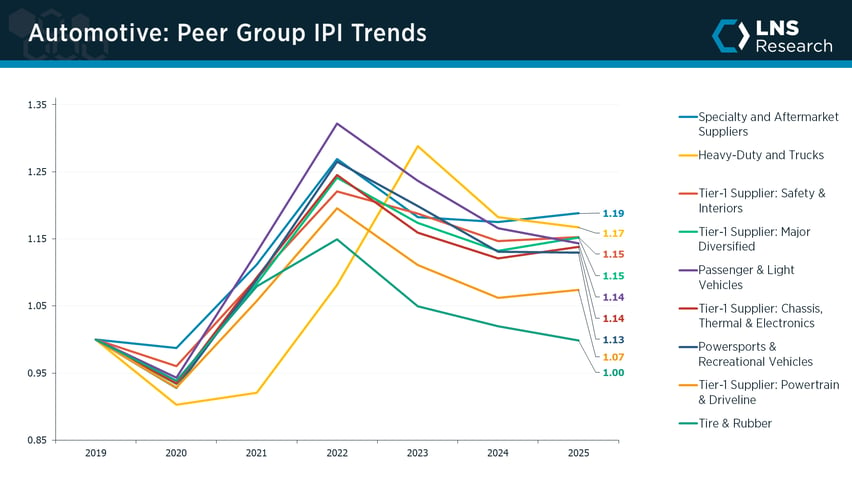
- Automotive ranks second of ten industries for industrial productivity in 2025, at a revenue-weighted score of 1.14.
- The retreat from the 2022 peak has continued: industry productivity slipped another 1.4% in 2025, and 9.2% over the past three years.
- 35 of 63 Automotive companies grew productivity last year; 28 declined. The big losses were concentrated in the major OEMs.
- Specialty & Aftermarket Suppliers (1.19) and Heavy-Duty & Trucks (1.17) led the peer groups in 2025, with Dorman Products, PACCAR, and Isuzu posting fresh productivity gains.
- Tier-1 Powertrain & Driveline (1.07) and Tire & Rubber (1.00) trail the rest of the industry. The EV transition continues to compress engine-tier productivity, and Tire & Rubber has fallen back to its 2019 baseline.
- Across the full 2019–2025 window Automotive has gained 13.8% in productivity. The industry peaked at 1.25 in 2022, and has retreated each of the three years since.
Automotive World's Most Productive Companies
Chemicals .svg)
Chemicals is one of the most cyclical industries in the index, with the dual challenge of complex asset and often commoditized products. After a strong start to the decade, the sector ran into a hard stretch as inflation, overcapacity, and soft demand converged.
2023 was a very hard year for Chemicals, as input-cost inflation, industry overcapacity, and lagging demand pulled productivity down across most of the sector. Companies responded aggressively in 2024, reducing and rearchitecting their supply bases and cost structures to fit the new environment.
That discipline showed up in 2025, when industry productivity edged slightly higher, a real accomplishment given where it started. The World’s Most Productive Companies led the turn: Corteva, Linde, CF Industries, and Avient embed reliability, quality, and energy performance into daily execution and have doubled down on digitalized decision-making across the value chain.
With technology, workforce, and operating model investments now underway, the future looks brighter than the past.

Industry Details
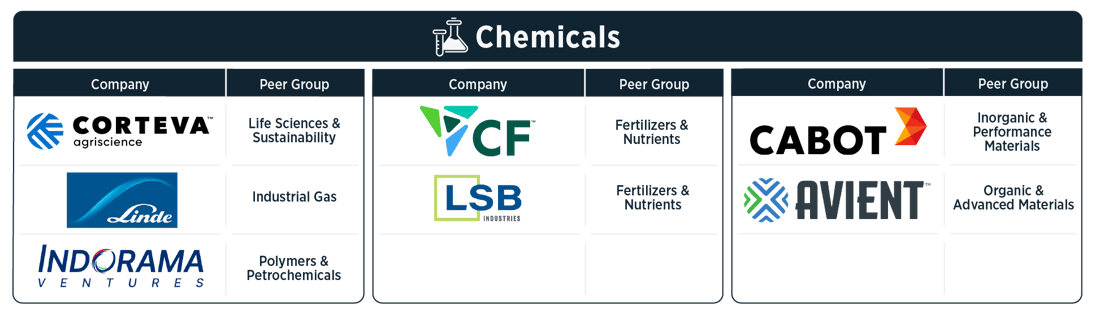
Chemicals were organized into peer groups classified by production focus, specialty orientation, and integration depth: Diversified Majors, Fertilizers & Nutrients, Industrial Gas, Inorganic & Performance Materials, Life Sciences & Sustainability, Organic & Advanced Materials, Paint and Coating, and Polymers & Petrochemicals. Forty-two companies were included in the Chemicals Index.
Chemicals Peer Groups
| Life Sciences & Sustainability | Industrial Gas | Polymers & Petrochemicals | Fertilizers & Nutrients |
| Inorganic & Performance Materials | Organic & Advanced Materials | Paint & Coating | Diversified Major |
Key Industry Productivity Statistics: Chemicals
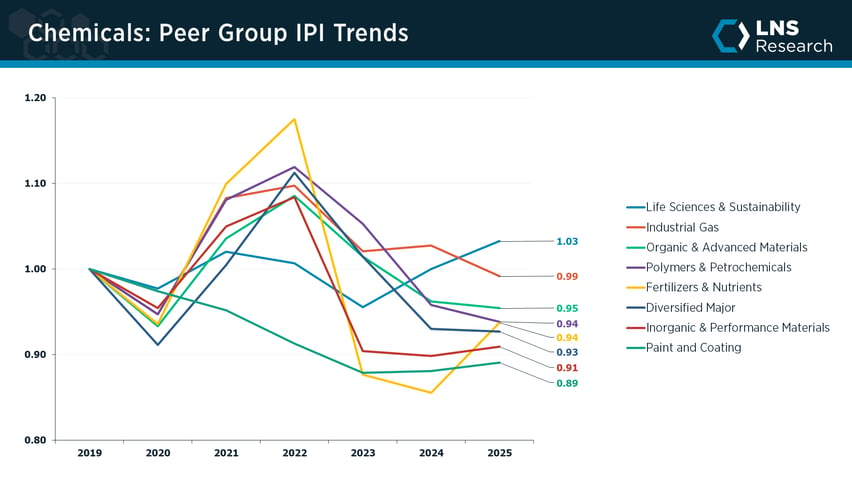
- Chemicals ranks ninth of ten industries for industrial productivity in 2025, at a revenue-weighted score of 0.95.
- After steep declines in 2023 and 2024, productivity edged up 0.3% in 2025, the first gain since the 2022 peak.
- 21 of 42 companies grew productivity in 2025, steadying the industry after a hard 2023.
- Life Sciences & Sustainability (1.03) led the peer groups, with World’s Most Productive Company Corteva at 1.21; Fertilizers & Nutrients rebounded hard as CF Industries and LSB Industries posted double-digit gains.
- Paint and Coating (0.89) and Inorganic & Performance Materials (0.91) lagged, held back by soft construction demand and Albemarle’s lithium slump.
- Chemicals is still down 5.4% since 2019, but the 2025 uptick and the cost and supply-base resets of 2024 point to a firmer footing ahead.
Chemicals World's Most Productive Companies
Consumer Products .svg)
Consumer Products is an eclectic mix of categories, from household staples and beauty to recreation, furniture, and tobacco, and productivity has always varied widely across them. The industry sits mid-pack, more focused on brands and supply chains than on the factory floor.
More recently the industry has been challenged on several fronts. Input cost inflation, decreasing demand, competition from retailer private-label brands, and supply chain disruptions have all weighed on performance. After a COVID-era bump that peaked in 2022, those pressures pulled productivity back, and Consumer Products is now essentially flat versus pre-COVID. Performance is inherently volatile and varies sharply by category. Home and personal care and beauty have held up best, with Haleon, Procter & Gamble, Unilever, and L’Oreal among the World’s Most Productive Companies, and luxury has remained a source of relative strength, with Richemont also ranking among the World’s Most Productive Companies. Tobacco fell hard on declining volumes, and furniture and parts of recreation stayed soft.
Industry Details
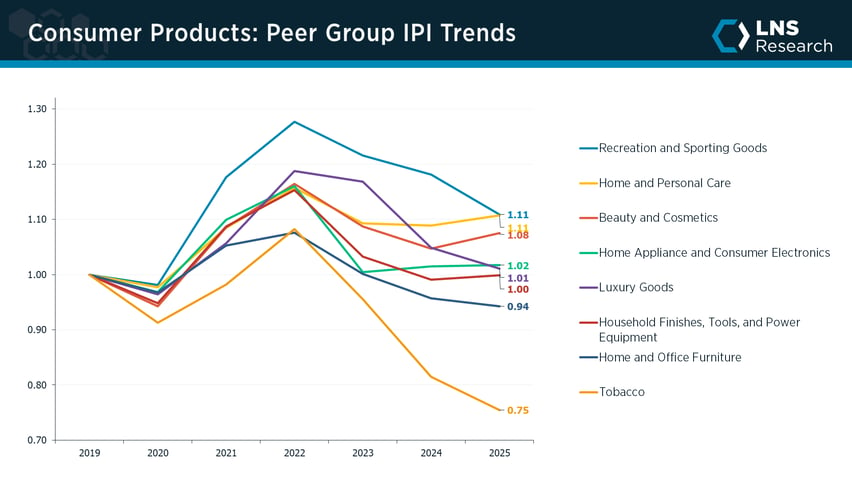
The Consumer Products sector is an eclectic assortment of peer groups covering a wide range of different products. LNS Research tracks productivity performance by peer group, which consists of companies within an industry that generally compete for the same business in the same markets. In Consumer Products, we study eight peer groups and have seen productivity performance vary widely across them.
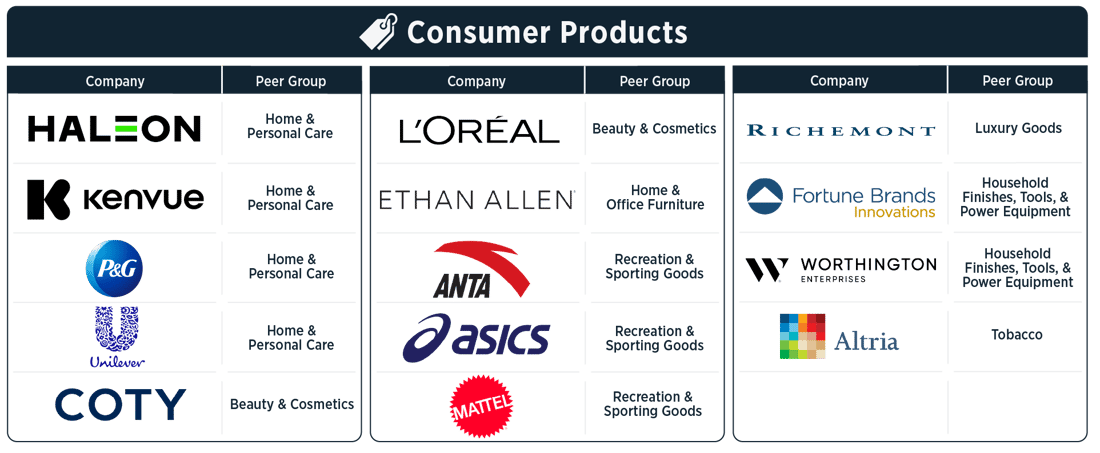
Consumer Products Peer Groups
| Home & Personal Care | Beauty & Cosmetics | Luxury Goods | Recreation & Sporting Goods |
| Finishes, Tools, & Power Equipment | Tobacco | Home Appliance & Consumer Electronics | Home & Office Furniture |
Key Industry Productivity Statistics: Consumer Products
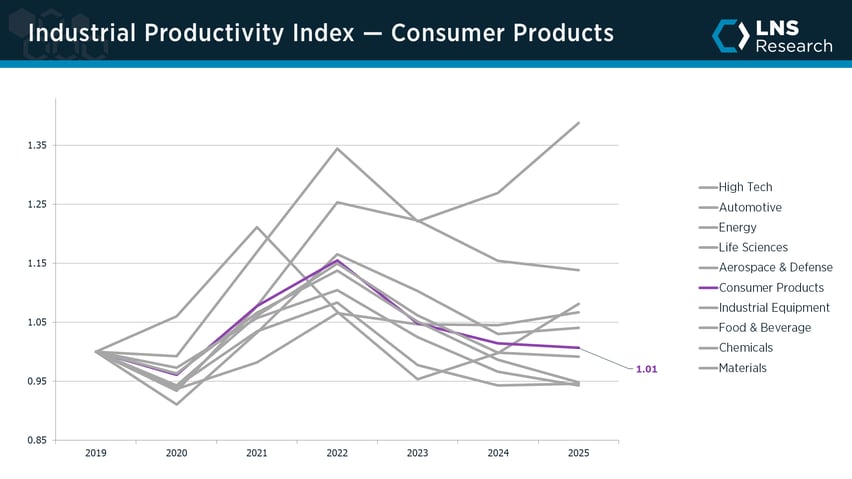
- Consumer Products ranks sixth of ten industries for industrial productivity in 2025, at a revenue-weighted score of 1.01.
- After peaking at 1.16 in 2022, the industry gave back ground through 2024 and was essentially flat in 2025, back near its 2019 baseline.
- 31 of 64 Consumer Products companies grew productivity in 2025; 33 declined, a near-even split across a very mixed field.
- Home and Personal Care (1.11) and Beauty and Cosmetics (1.08) held up best, and Luxury Goods (1.01) stayed resilient, with World’s Most Productive Companies Haleon, Procter & Gamble, L’Oreal, and Richemont among the steadier performers.
- Tobacco (0.75) was the clear laggard as volumes kept falling across every major brand, and Home and Office Furniture (0.94) stayed soft on weak discretionary demand.
- Across 2019–2025 the industry is essentially flat, up only about 1%, as input inflation, decreasing demand, private-label competition, and supply chain disruptions weighed on more recent results.
Consumer Products World's Most Productive Companies
Energy .svg)
Energy has long been one of the weakest industrial productivity performers, weighed down by limited capital investment, difficulty attracting talent, and a focus on short-term shareholder returns over long-term value creation.
That has started to change. Energy was one of the strongest performers in 2025, rebounding sharply off its 2023 trough as capital discipline, consolidation, and operational modernization took hold. Upstream producers and the integrated majors led the way, and Chevron and Petrobras both rank among the World’s Most Productive Companies, pairing predictive analytics, digital twins, and advanced process control with decarbonization to drive cross-value-chain visibility. After two decades of decline, the industry is back above its 2019 starting point and climbing.
Industry Details
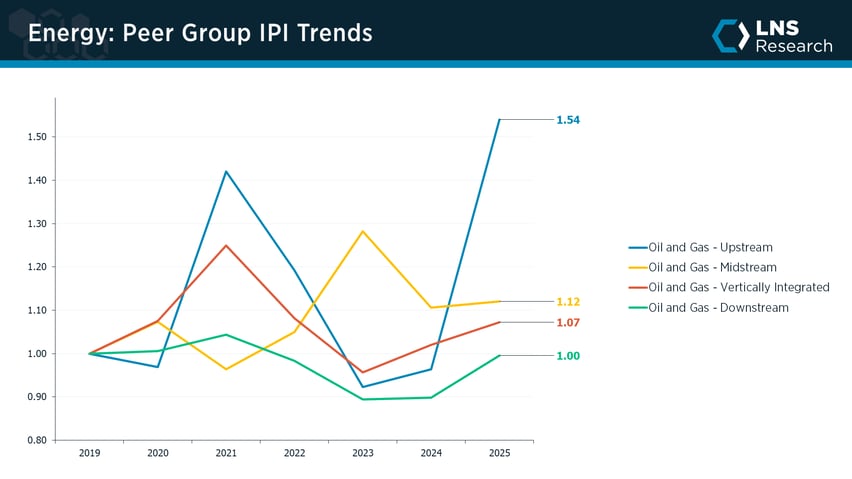
The Energy index covers oil and gas across the value chain, grouped into upstream producers, midstream transport and processing, downstream refining, and the vertically integrated majors. Each peer group carries a different cyclicality and labor-intensity profile, from capital-intensive extraction to utilization-driven refining, so peer-group mix matters when comparing performance. Thirty companies are included in the Energy Index.
Energy Peer Groups
Key Industry Productivity Statistics: Energy
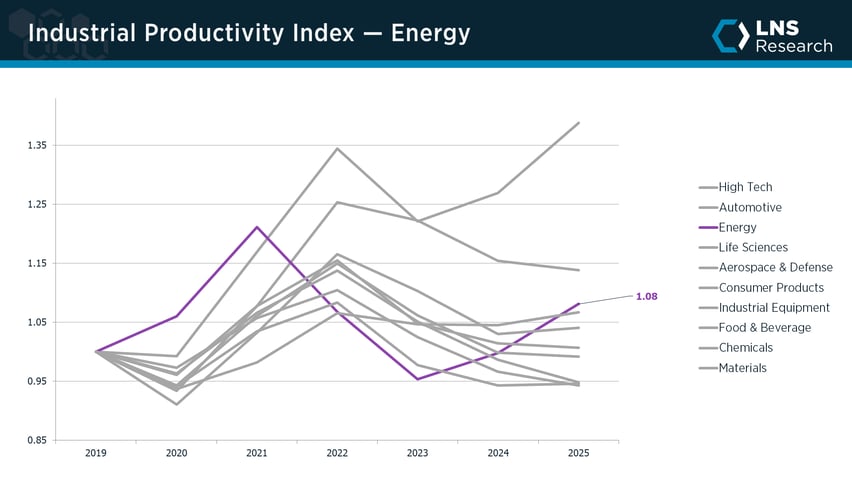
- Energy ranks third of ten industries for industrial productivity in 2025, at a revenue-weighted score of 1.08.
- Energy was one of the strongest performers in 2025, up 8.3% year over year and back above its 2019 baseline after a long decline.
- 22 of 29 Energy companies grew productivity last year; only 7 declined, the most broadly positive result of any industry.
- Oil & Gas Upstream (1.54) surged the most, and Midstream (1.12) and the Vertically Integrated majors (1.07) also gained, with World’s Most Productive Companies Chevron and Petrobras among the leaders.
- Downstream refiners (1.00) trailed the rest of the sector but recovered through the year, with Phillips 66 and Marathon Petroleum posting solid gains.
- Across 2019–2025 Energy gained about 8%, a turnaround driven by capital discipline, consolidation, and operational modernization across the value chain.
Energy World's Most Productive Companies

Food & Beverage .svg)
Food and Beverage is a low-margin, labor-intensive industry with a deep operational excellence culture. Years of investment in approaches like TPM, OEE, connected frontline work, and smart manufacturing have made it one of the stronger long-run productivity performers in industrial.
That long-run strength did not carry into 2025. Branded packaged food bore the brunt, as softening demand, shoppers trading down to private label, and shifting consumption habits pulled volumes lower. Hershey, Mondelez, PepsiCo, General Mills, and Nestlé all gave back ground, and the industry slipped back below its 2019 baseline. The bright spots were elsewhere. Alcoholic beverages and the ingredient and flavor makers held up, with Remy Cointreau, Constellation Brands, Givaudan, and Kerry Group ranking among the World’s Most Productive Companies. The operational foundation remains, but a demand-led reset across branded food has set the industry back.
Industry Details
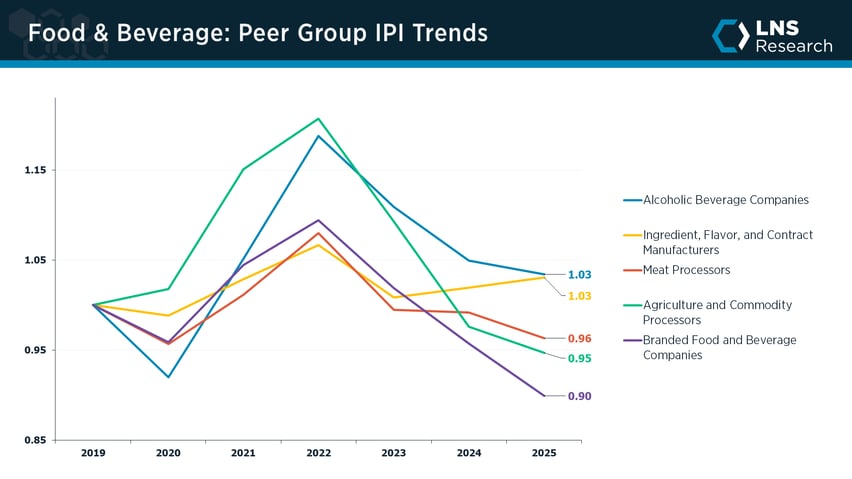
Categories in the Food and Beverage industry were based on product type, with a split between alcoholic and non-alcoholic beverages, agricultural products, and a range of packaged foods, including snacks, dairy products, and confectionery. Several of the packaged food companies had different levels of vertical integration, which was accounted for, in addition to product type mixes: Agricultural commodities and products, beverages, ingredients and flavors, and packaged (cereal, confectionery, dairy, etc.). Fifty-three companies are included in the Food and Beverage Index.
Food & Beverage Peer Groups
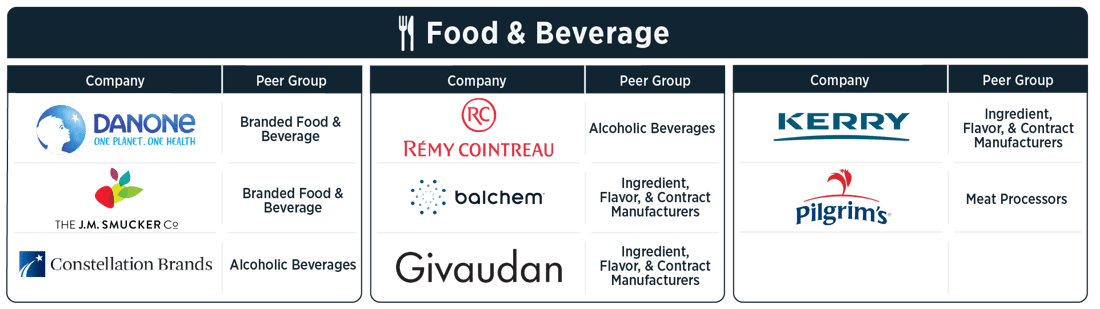
| Agriculture & Commodity Processors | Branded Food & Beverage | Alcoholic Beverages | Ingredients, Flavors, & Contract Manufacturers |
| Meat Processors |
Key Industry Productivity Statistics: Food & Beverage
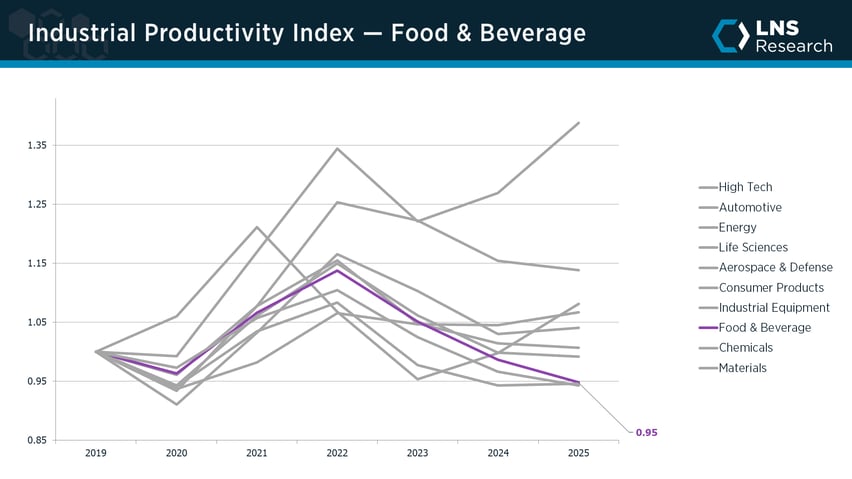
- Food and Beverage ranks eighth of ten industries for industrial productivity in 2025, at a revenue-weighted score of 0.95.
- After peaking at 1.14 in 2022, productivity fell each of the next three years, dropping 3.9% in 2025 to below its 2019 baseline.
- Only 15 of 52 Food and Beverage companies grew productivity last year; 37 declined, with the losses concentrated in branded packaged food.
- Alcoholic Beverages (1.03) and Ingredients, Flavors, and Contract Manufacturers (1.03) led the peer groups, with World’s Most Productive Companies Remy Cointreau, Constellation Brands, Givaudan, and Kerry Group setting the pace.
- Branded Food and Beverage (0.90) was the clear laggard as demand softened and shoppers traded down, pulling Hershey, Mondelez, and PepsiCo sharply lower.
- Across 2019–2025 the industry gave back about 5%, as a demand-led reset in branded food offset the operational gains that long made it a productivity leader.
Food & Beverage World's Most Productive Companies
High-Tech .svg)
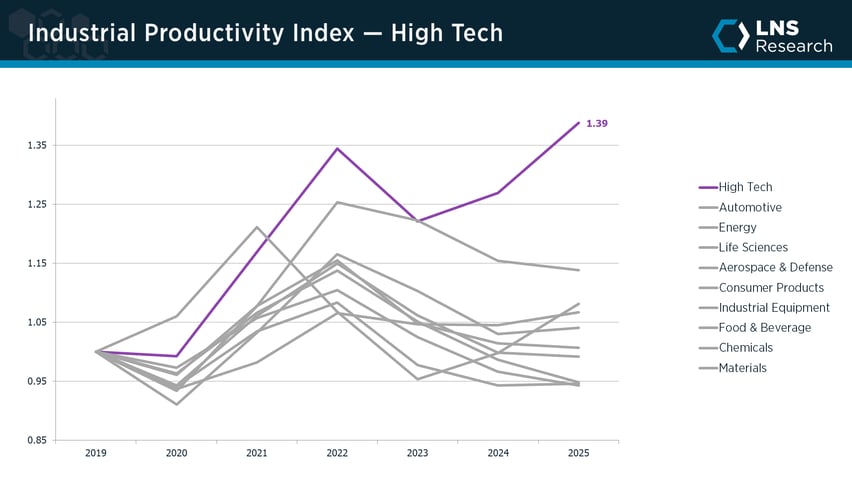
High-Tech is the strongest industrial productivity performer by a wide margin. Having moved well beyond low-cost labor arbitrage, these companies invest more capital in highly automated manufacturing than any other industry, pairing Industrial AI with tight integration across engineering, manufacturing, and supply chain.
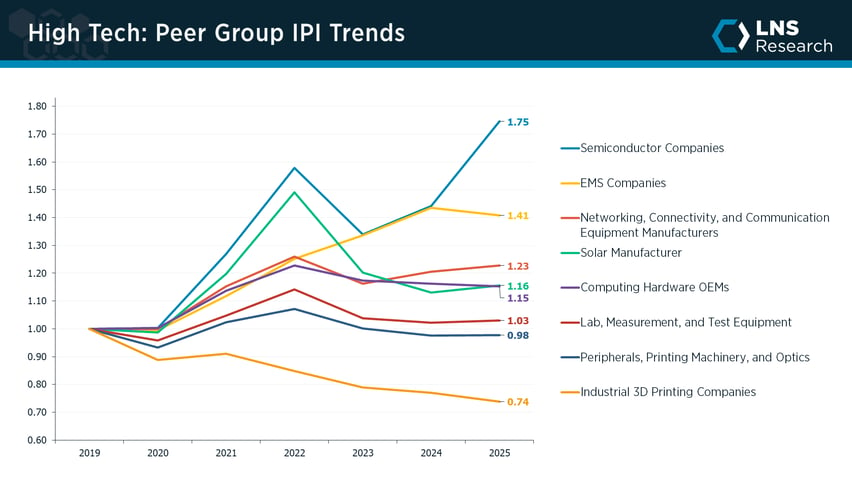
2025 extended that lead. The revenue-weighted index rose to a new high, powered by a surge in semiconductors as AI demand drove capacity and output across the leading fabs. A shortage of specialized memory, particularly the high-bandwidth memory that AI accelerators depend on, lifted SK Hynix sharply, while TSMC, GlobalFoundries, and Renesas also led. EMS providers like Celestica, Flex, and Benchmark, and networking makers Ericsson and Nokia all rank among the World’s Most Productive Companies. The strength was narrow, though. Most of the gains concentrated in the largest chipmakers, and a majority of high-tech companies actually saw productivity slip, with industrial 3D printing and parts of the long tail lagging well behind.
Industry Details
High-Tech spans the electronics value chain, grouped into semiconductors, electronic manufacturing services (EMS), networking and communication equipment, computing hardware, lab, measurement, and test equipment, solar manufacturing, peripherals and optics, and industrial 3D printing. The groups differ widely in capital intensity and cyclicality, so peer-group mix matters when comparing performance. Sixty companies are included in the High-Tech Index.
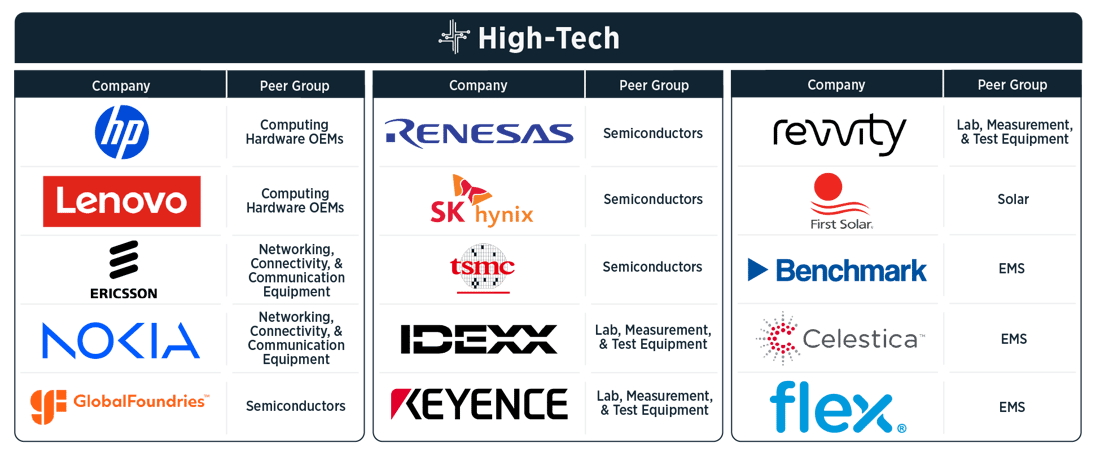
High-Tech Peer Groups
| Semiconductors | Lab, Measurement, & Testing Equipment | Solar | Imaging |
| Electronic Manufacturing Services | Computing Hardware OEMs | Industrial 3D Printing | Networking & Communication Equipment |
Key Industry Productivity Statistics: High-Tech
- High-Tech ranks first of ten industries for industrial productivity in 2025, at a revenue-weighted score of 1.39, the highest of any sector.
- The industry set a new high in 2025, up roughly 39% since 2019, by far the strongest long-run record in industrial.
- The gains were narrow: only 27 of 60 High-Tech companies grew productivity last year, with the increase concentrated in the largest semiconductor makers.
- Semiconductors (1.75) surged on AI-driven demand, and EMS (1.41) and Networking (1.23) also led, with the World’s Most Productive Companies including SK Hynix, TSMC, GlobalFoundries, Celestica, and Ericsson.
- Industrial 3D Printing (0.74) was the clear laggard, with 3D Systems and Stratasys well below the rest of the sector.
- Across 2019–2025, High-Tech gained about 39%, a sustained lead built on heavy capital investment in automated, AI-enabled manufacturing.
High-Tech World's Most Productive Companies
Industrial Equipment .svg)
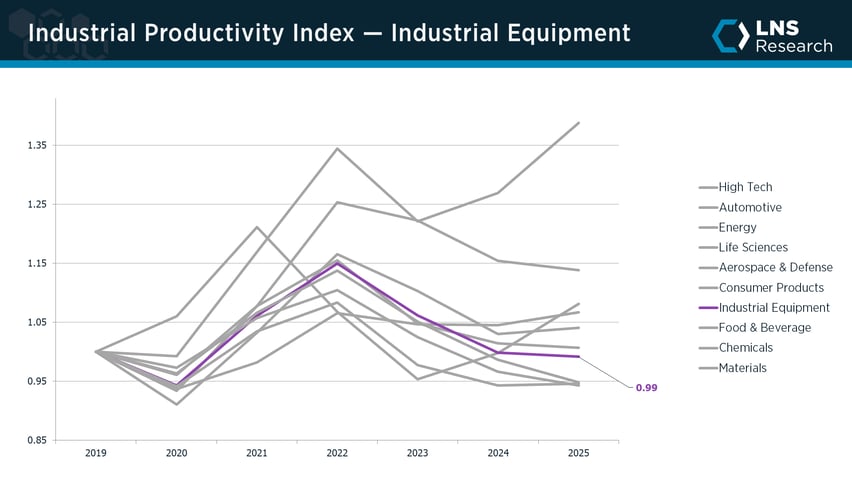
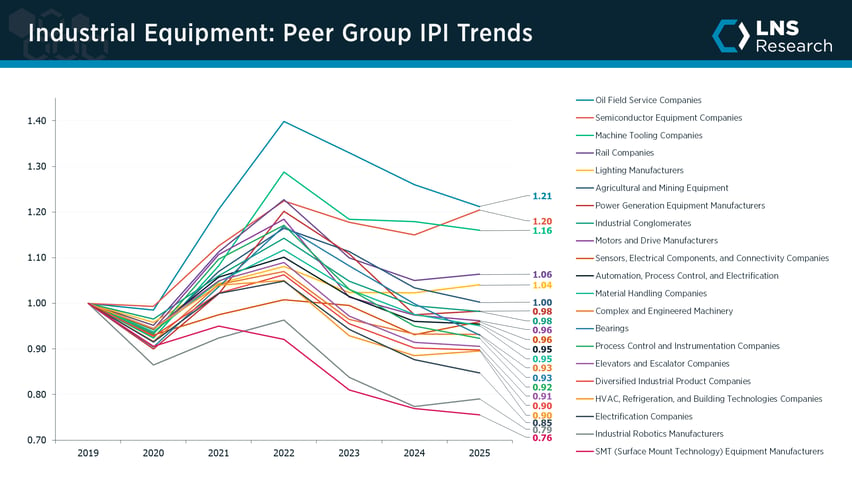
Industrial Equipment is the largest and most fragmented industry in the study, with 125 companies spanning 21 peer groups, from agricultural, mining, and construction machinery to semiconductor equipment, automation, bearings, and sensors. Most of these firms are product-centric, earning revenue from equipment sales, though many are shifting toward service and digital models. Productivity has historically tracked the broader macro cycle.
After the post-2022 give-back, Industrial Equipment was essentially flat in 2025, sitting right at its 2019 baseline. With so many segments, the picture is mixed. The capex-exposed groups did best: semiconductor equipment rode the chip and AI buildout, with ASML, Applied Materials, and Screen Holdings among the World’s Most Productive Companies, and oil field services gained with energy investment behind SLB and Halliburton. Machine tooling and rail also held up, with DMG Mori and Wabtec ranking among the World’s Most Productive Companies. The drag came from shorter-cycle and building-related segments, where robotics, electrification, HVAC and building technologies, and general machinery stayed soft on weaker demand.
Industry Details
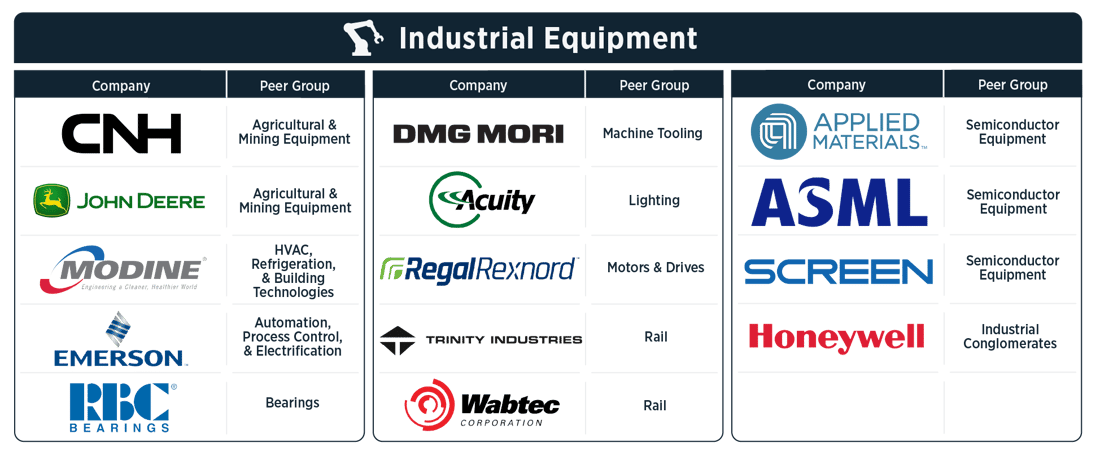
The Industrial Equipment industry encompasses a diverse range of manufacturers organized into 21 peer groups, covering everything from large-scale machinery, such as agricultural, mining, construction, and semiconductor equipment, to specialized industrial components, including bearings, automation systems, lighting, and sensors. It also includes diversified product companies and some of the world’s largest industrial conglomerates, reflecting the sector’s broad scope and critical role across nearly every area of the industrial sector.
Industrial Equipment Peer Groups
Key Industry Productivity Statistics: Industrial Equipment
- Industrial Equipment ranks seventh of ten industries for industrial productivity in 2025, at a revenue-weighted score of 0.99.
- After peaking at 1.15 in 2022, the industry gave back ground and finished 2025 essentially flat, right at its 2019 baseline.
- The field is split: 54 of 123 companies grew productivity last year and 69 declined, across the study’s largest and most fragmented industry.
- The capex-exposed groups led: Oil Field Services (1.21) and Semiconductor Equipment (1.20) rose on energy and chip investment, with World’s Most Productive Companies ASML, Applied Materials, and Screen Holdings among the strongest.
- The laggards were shorter-cycle: SMT equipment (0.76), Industrial Robotics (0.79), and Electrification (0.85) trailed on softer demand.
- Across 2019–2025 the industry is essentially flat, as strength in semiconductor and energy equipment offset persistent weakness across the building-related and shorter-cycle segments.
Industrial Equipment World's Most Productive Companies
Life Sciences .svg)
Life Sciences companies have historically lagged on industrial productivity, running on above-average operating margins and focused more on R&D success and regulatory compliance than on the cost and efficiency of manufacturing. That is changing. A generational wave of capital investment, in the form of billion-dollar-plus sites built around new technology and digital approaches, now reaches across the value chain, tying R&D to the patient experience, embedding quality and compliance, and enabling cell and gene therapy and other personalized medicines at scale.
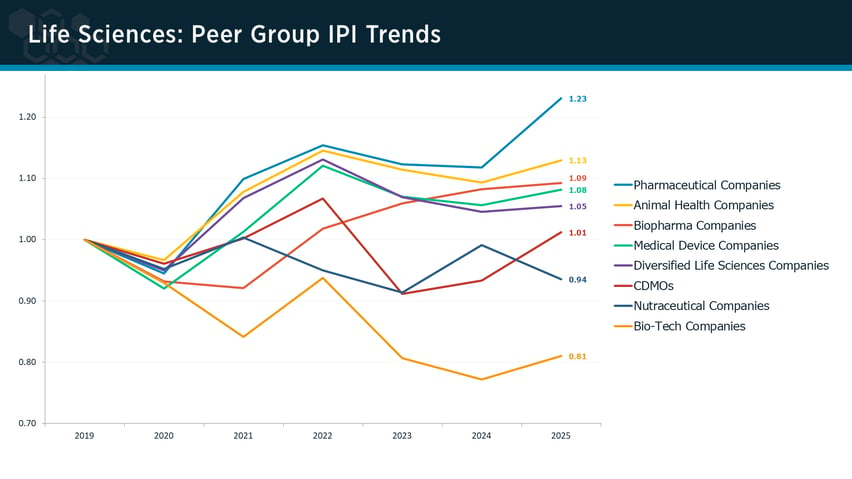
That investment is starting to show up in the numbers. Life Sciences ranks fourth of ten industries in 2025 and sits at its highest level since the post-COVID surge, comfortably above its 2019 baseline. Demand is steady and largely non-cyclical, and the gains were broad, with 46 of 69 companies improving on the year. Pharmaceutical and animal health companies led, and among the World’s Most Productive Companies, Eli Lilly, GSK, and Merck in biopharma, Zoetis in animal health, and Danaher, Johnson & Johnson, and GE HealthCare across diversified life sciences and medical devices set the pace. The soft spot was bio-tech, where Amgen, Biogen, and Regeneron stayed well below the field, along with some parts of large-cap biopharma.

Key Industry Details
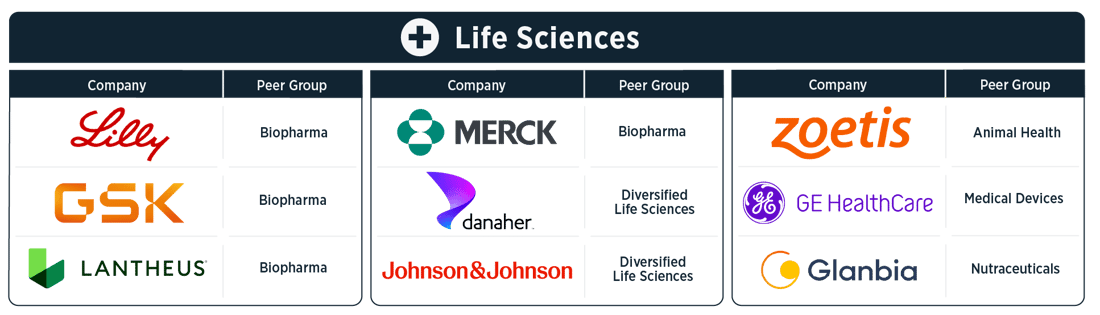
The Life Sciences industry was split by the type of health and medical focus, including biotech, pharmaceuticals, medical devices, and contract manufacturers. The pharmaceutical category distinguishes specialized pharma companies from the larger, more diversified ones, with scope to further differentiate based on the type of drugs and diseases targeted: Biotech, CDMO and distributors, Medical devices, Pharmaceuticals (diversified across disease areas), and Pharmaceuticals (specialized disease areas). Sixty-nine companies were included in the Life Sciences Index.
Life Sciences Peer Groups
| Biopharma | Diversified Life Sciences | Animal Health | Medical Devices |
| Nutraceuticals | Bio-Tech | CDMOs | Pharmaceutical |
Key Industry Productivity Statistics: Life Sciences
- Life Sciences ranks fourth of ten industries for industrial productivity in 2025, at a revenue-weighted score of 1.07.
- Productivity rose 2.1% in 2025 to its highest level since the post-COVID surge, leaving the industry about 7% above its 2019 baseline.
- The gains were broad: 46 of 69 Life Sciences companies grew productivity last year, and only 23 declined.
- Pharmaceutical Companies (1.23) and Animal Health Companies (1.13) led the peer groups; among the World’s Most Productive Companies, Eli Lilly, GSK, and Merck in biopharma and Zoetis in animal health set the pace.
- Bio-Tech Companies (0.81) and Nutraceutical Companies (0.94) trailed, with Amgen, Biogen, and Regeneron well below the rest of the field.
- Across 2019–2025 the industry gained about 7%, recovering from a long decline as a generational wave of capital investment began to lift manufacturing productivity.
Life Sciences World's Most Productive Companies
Materials .svg)
Materials companies have historically struggled to grow industrial productivity. Many face the same headwinds as other process industries, including light capital investment, workforce gaps, and underdeveloped operational excellence and operating models, compounded by a boom-and-bust commodity cycle and a string of high-profile digital transformations that failed to deliver. The bright spots have come from building products, packaging, and metals companies that are taking on business-led transformations, embracing new operating models, advanced analytics, and virtual operations center approaches.
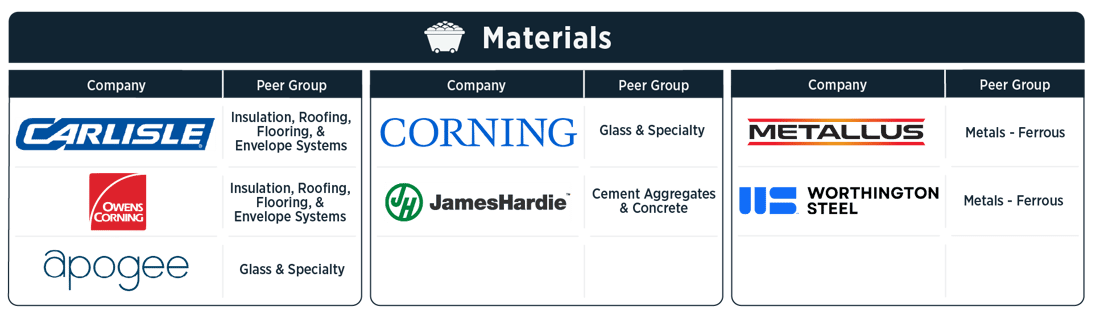
2025 was a hard year. Materials finished last among the ten industries and below its 2019 baseline, extending a decline that has run since the 2022 peak. Demand was soft across construction and heavy industry, and the breadth was poor, with only 17 of 73 companies improving on the year. The weakness was concentrated in the commodity-heavy groups, including integrated metal and mining, cement and aggregates, ferrous metals, and packaging, where overcapacity and slack volumes weighed on the likes of Cleveland-Cliffs, Tata Steel, and Smurfit WestRock. The standouts came from the building-envelope and specialty side, where operational discipline set the World’s Most Productive Companies apart, with Carlisle and Owens Corning in insulation and roofing, Corning and Apogee in glass, and James Hardie in cement and concrete leading their peers.
Industry Details
The diverse Materials industry includes a range of companies, from those that refine, process, and mine metals, to those that mine minerals, spanning specific metals such as aluminum, copper, gold, and steel. Additionally, the industry also includes several types of building material companies, packaging, and specialty materials, organized by product type: Building materials (aggregates and construction, home improvement, roofing, etc.); Metals and mining (Aluminum, Copper, Gold, etc.); Packaging (glass, metal, plastic, etc.); and Specialty materials. Seventy-three companies were included in the Materials Index.
Materials Peer Groups
Key Industry Productivity Statistics: Materials
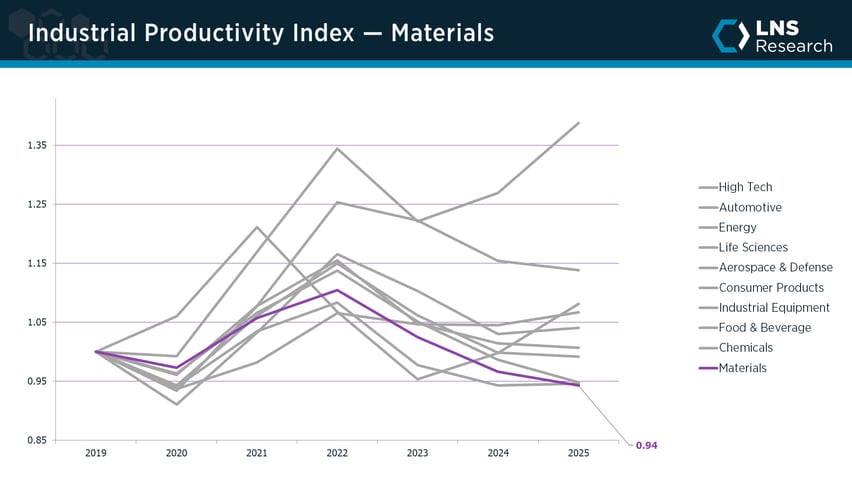
- Materials ranks tenth of ten industries for industrial productivity in 2025, at a revenue-weighted score of 0.94, the lowest of any industry.
- After peaking at 1.10 in 2022, productivity fell for a third straight year, down 2.4% in 2025 to below its 2019 baseline.
- Breadth was weak: only 17 of 73 Materials companies grew productivity last year, while 56 declined.
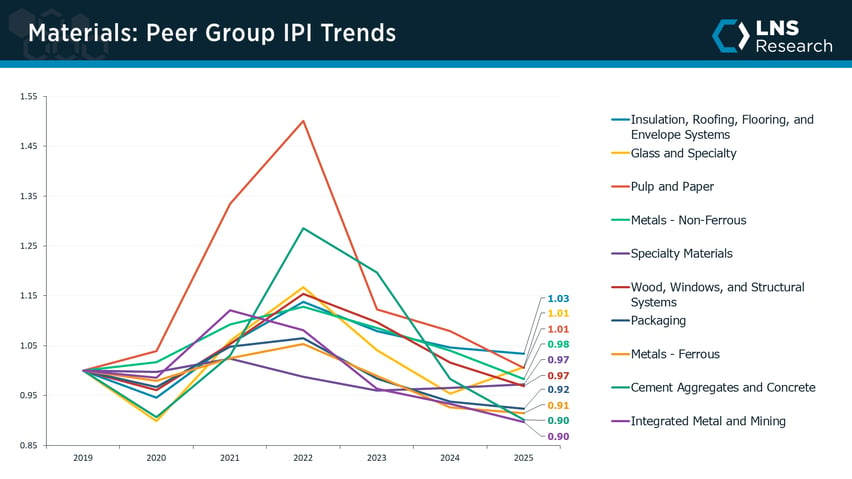
- The building-envelope groups held up best, led by Insulation, Roofing, Flooring, and Envelope Systems (1.03) and Glass and Specialty (1.01), with World’s Most Productive Companies Carlisle, Owens Corning, Corning, and Apogee standing out.
- The commodity-heavy groups lagged: Integrated Metal and Mining (0.90), Cement Aggregates and Concrete (0.90), and Metals - Ferrous (0.91) trailed on overcapacity and soft demand.
- Across 2019–2025 Materials gave back about 6%, the weakest long-run record of any industry, as commodity cyclicality offset the gains made by its strongest building-products and specialty companies.
Materials World's Most Productive Companies

Attend An
Event
Engage with senior operations leaders and explore strategies that drive real productivity gains

Read The
Report
Discover the data and insights behind the world’s most productive companies

Book a Pathfinder Benchmarking Call
Benchmark your performance and uncover your biggest opportunities for impact