Aerospace & Defense .svg)
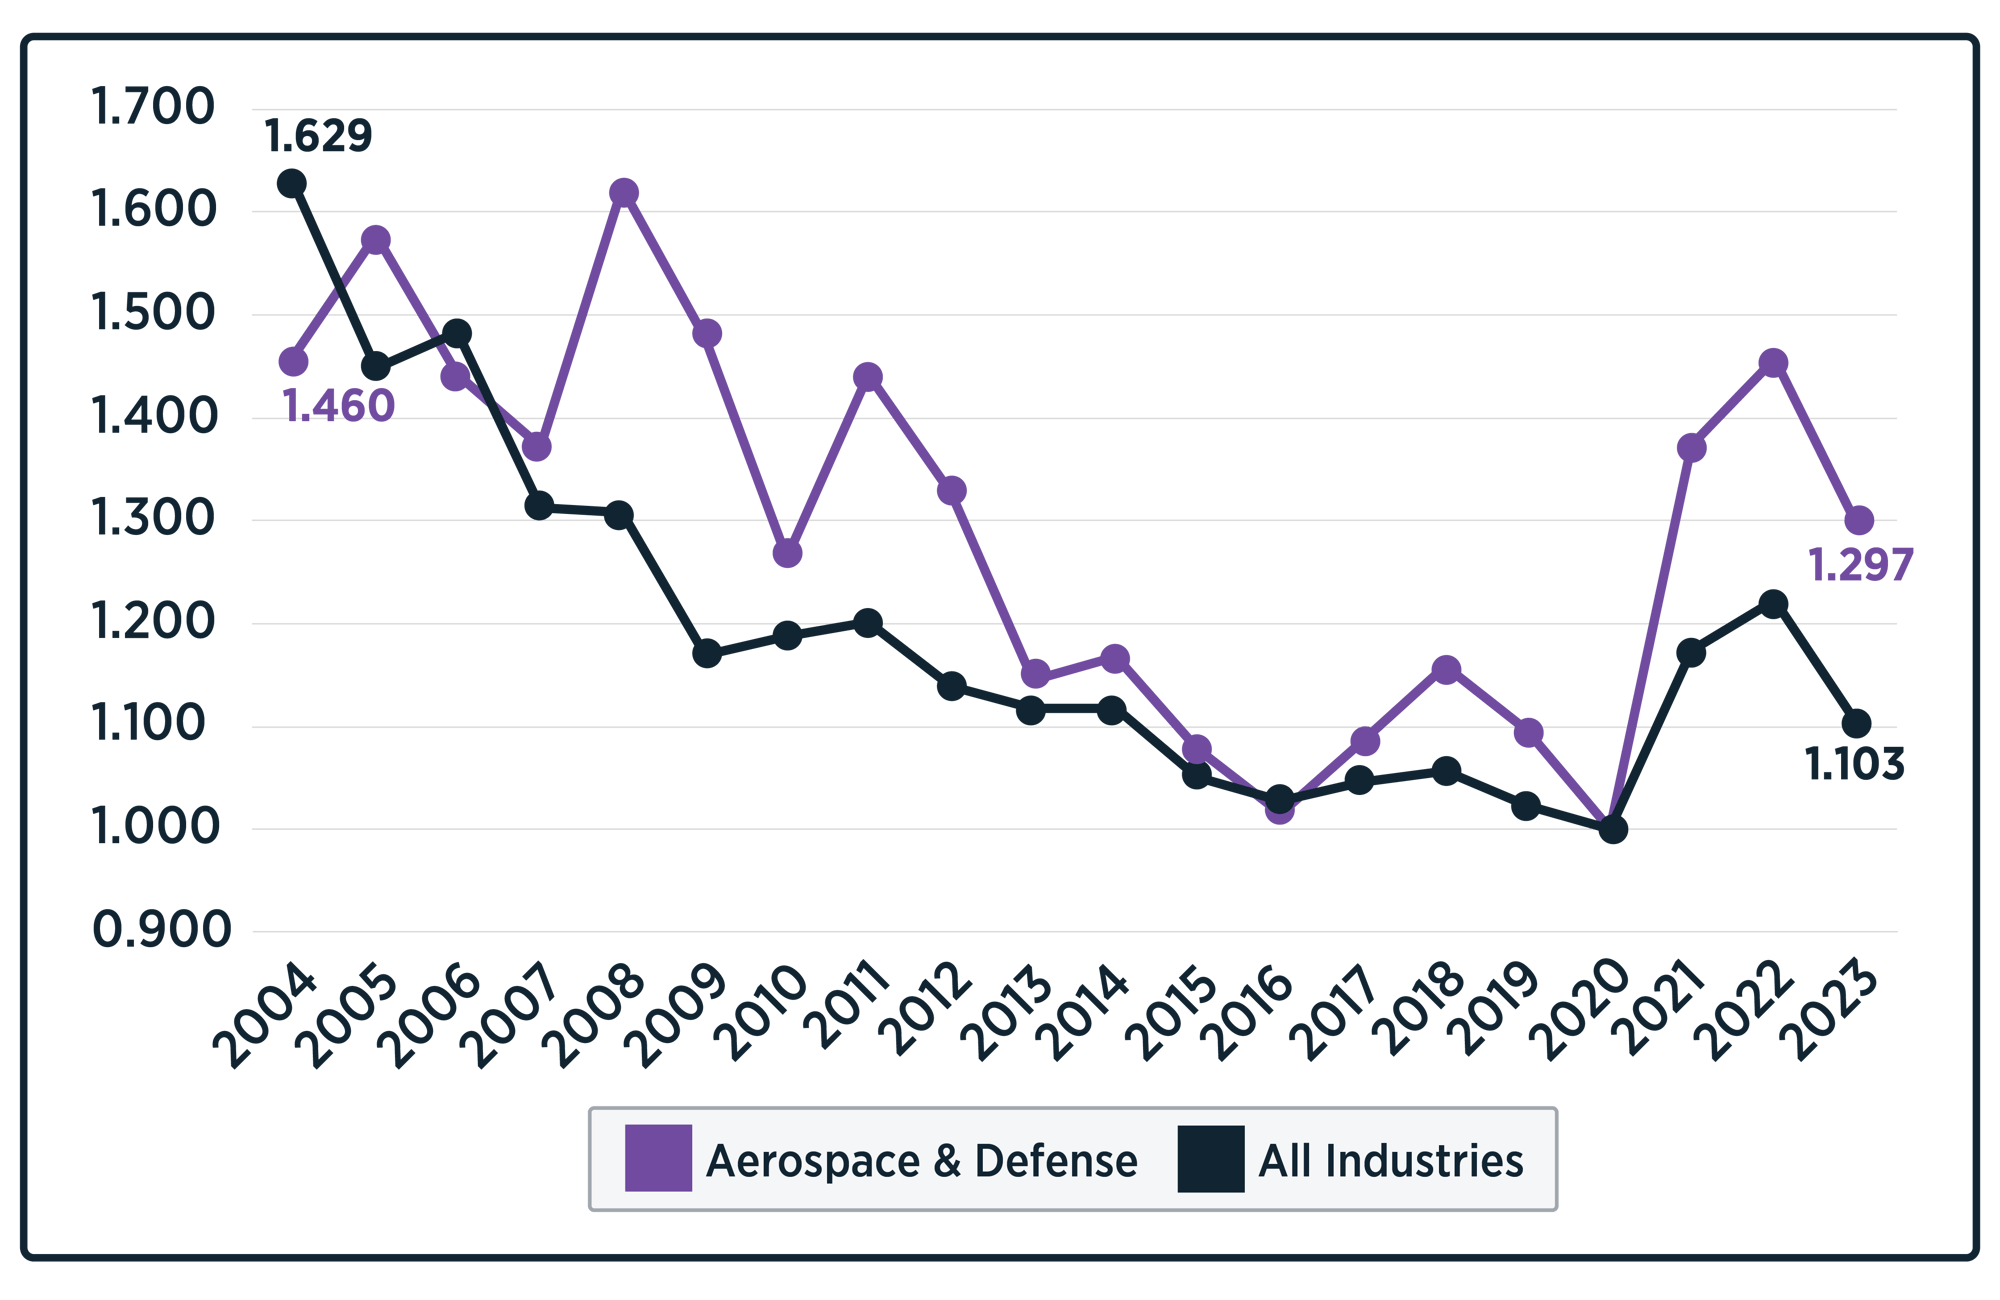
Aerospace and Defense companies have historically struggled with industrial productivity. Cost-plus government contracts, manual processes, disconnects between engineering and operations, complex products, and a move to lifecycle services have all hampered performance.
But since 2020, no industry has performed better. Investments in digital twin, digital thread, and new operating models have enabled the industry to thrive, while being supported by macroeconomic tailwinds – exemplified by Pathfinders like GE Aerospace and Rolls-Royce PLC.
Industry Details
The Aerospace and Defense companies were grouped based on production focus, ranging from OEM providers (aircraft, shipbuilding) to suppliers of control systems, engines, and defense systems. We also accounted for certain diversified companies with footprints in multiple categories: Aircraft; Defense and military systems (armored vehicles, ships and boats, weapon systems, etc.); and Aircraft parts (control systems, engines, and components, etc.). Thirty-one companies were included in the A&D Index.
Key Industry Productivity Statistics
- The Aerospace and Defense Industrial Productivity trendline is a flatter curve than the IPI curve overall. The industry had “only” a 5.2% decline in productivity over the last 20 years.
- The industry saw 48.1% productivity growth from 2020 to 2022 as the airline industry rebounded from COVID and Boeing production shut down.
- The industry has regressed to stagnation and decline with a 16.2% productivity drop from 2022 to 2024.
- Last year, the industry had an 8% productivity decline.
- 77% of companies had negative productivity growth from 2021 to 2024 (though 2021 was a strong year generally).
- 25 of 31 companies regressed in productivity last year.
Automotive .svg)
Automotive companies have historically been top industrial productivity performers. A long tradition of pioneering new manufacturing production processes and an early embrace of Lean manufacturing operating models – based on the principles of the Toyota Production System – have all yielded significant results.
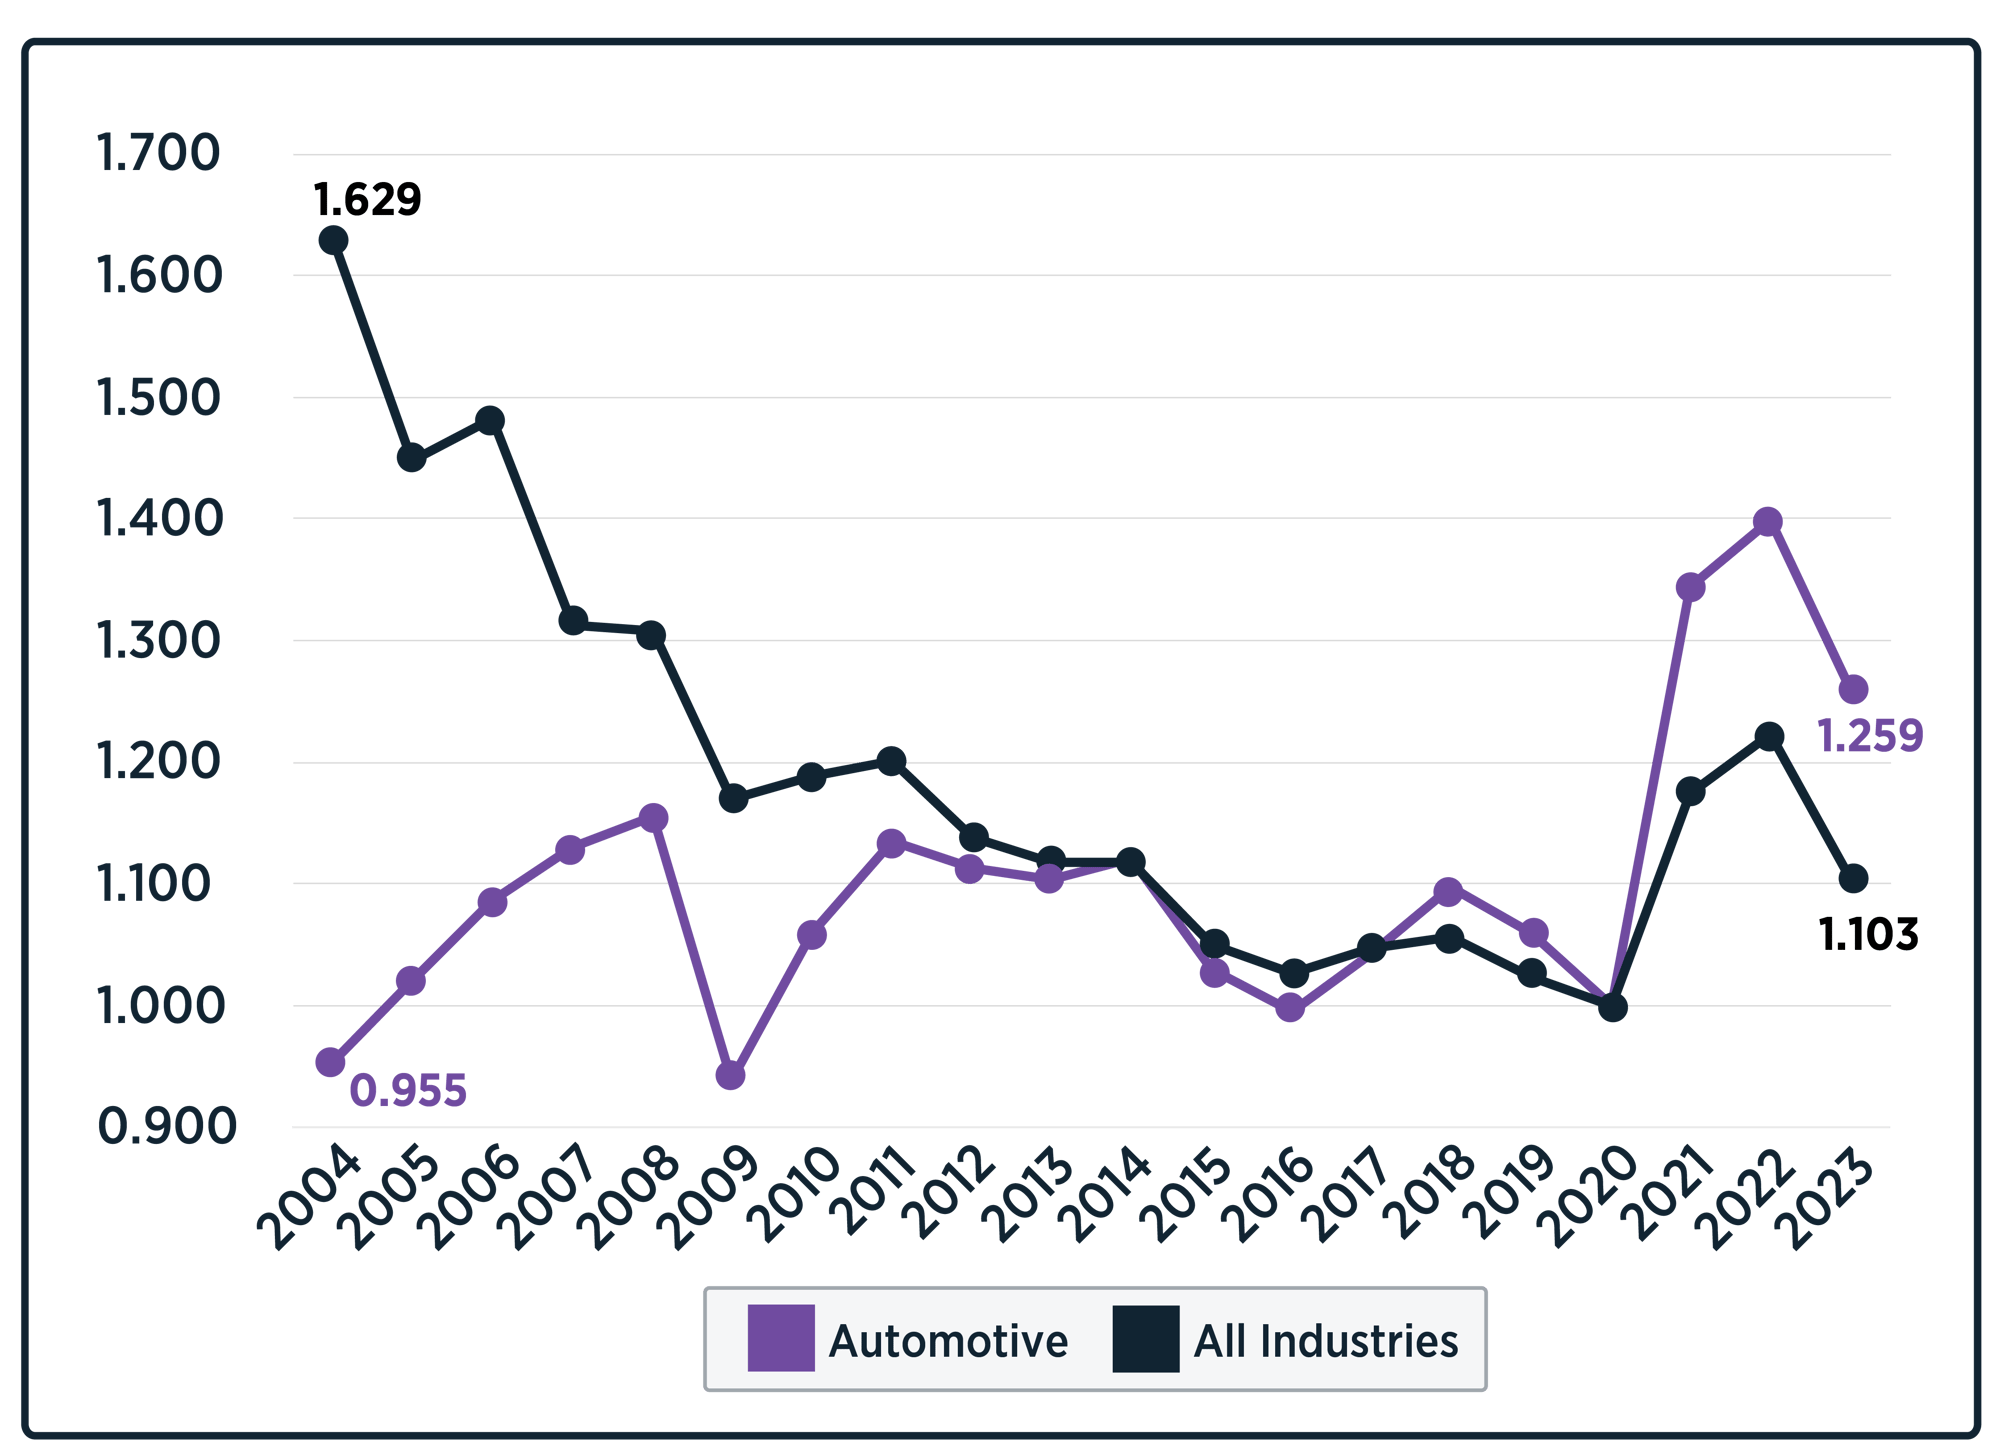
Since 2020, that success continued as the #2 most productive industry, especially as leaders brought together Industry 4.0 and Lean together in a transformation approach exemplified by companies like Mercedes-Benz and Polaris. Since 2022, however, demand reductions and EV oscillations have weighed on productivity growth.
Industry Details
The Automotive sector was split by vehicle types (electric, gas-powered, heavy duty) and a wide range of suppliers differentiated by components, like powertrains, interiors, exteriors, electronics, and tires: Electric vehicles; Gas-powered vehicles; Heavy-duty and motorcycles; Aftermarket parts; Electrical and electronics components; Exterior and chassis components; Interiors; Powertrain and transmission; and Tires. Fifty companies were included in the Automotive Index.
Key Industry Productivity Statistics
- The Automotive Industry was one of three industries (along with High Tech and F&B) that demonstrated Productivity growth over the last 20 years. The industry grew productivity by 22.2% from 2004 to 2024. In fact, it is fair to say that High Tech and Automotive hid the real scale of the Productivity Crisis by offsetting much of the decline across the other industries.
- Like other industries, the Automotive industry had a strong COVID Productivity bounce of 40.1% from 2020 to 2022.
- The Automotive industry began to decline from that COVID high with a 17.1% productivity decline from 2022 to 2024.
- Last year, the Automotive Industry regressed with seven other industries recording a 7.9% productivity decline.
- 92% of Automotive Companies regressed in productivity over the last three years.
- 40 of 50 companies had negative productivity growth last year.
- 25 of 31 companies regressed in productivity last year.
Chemicals .svg)
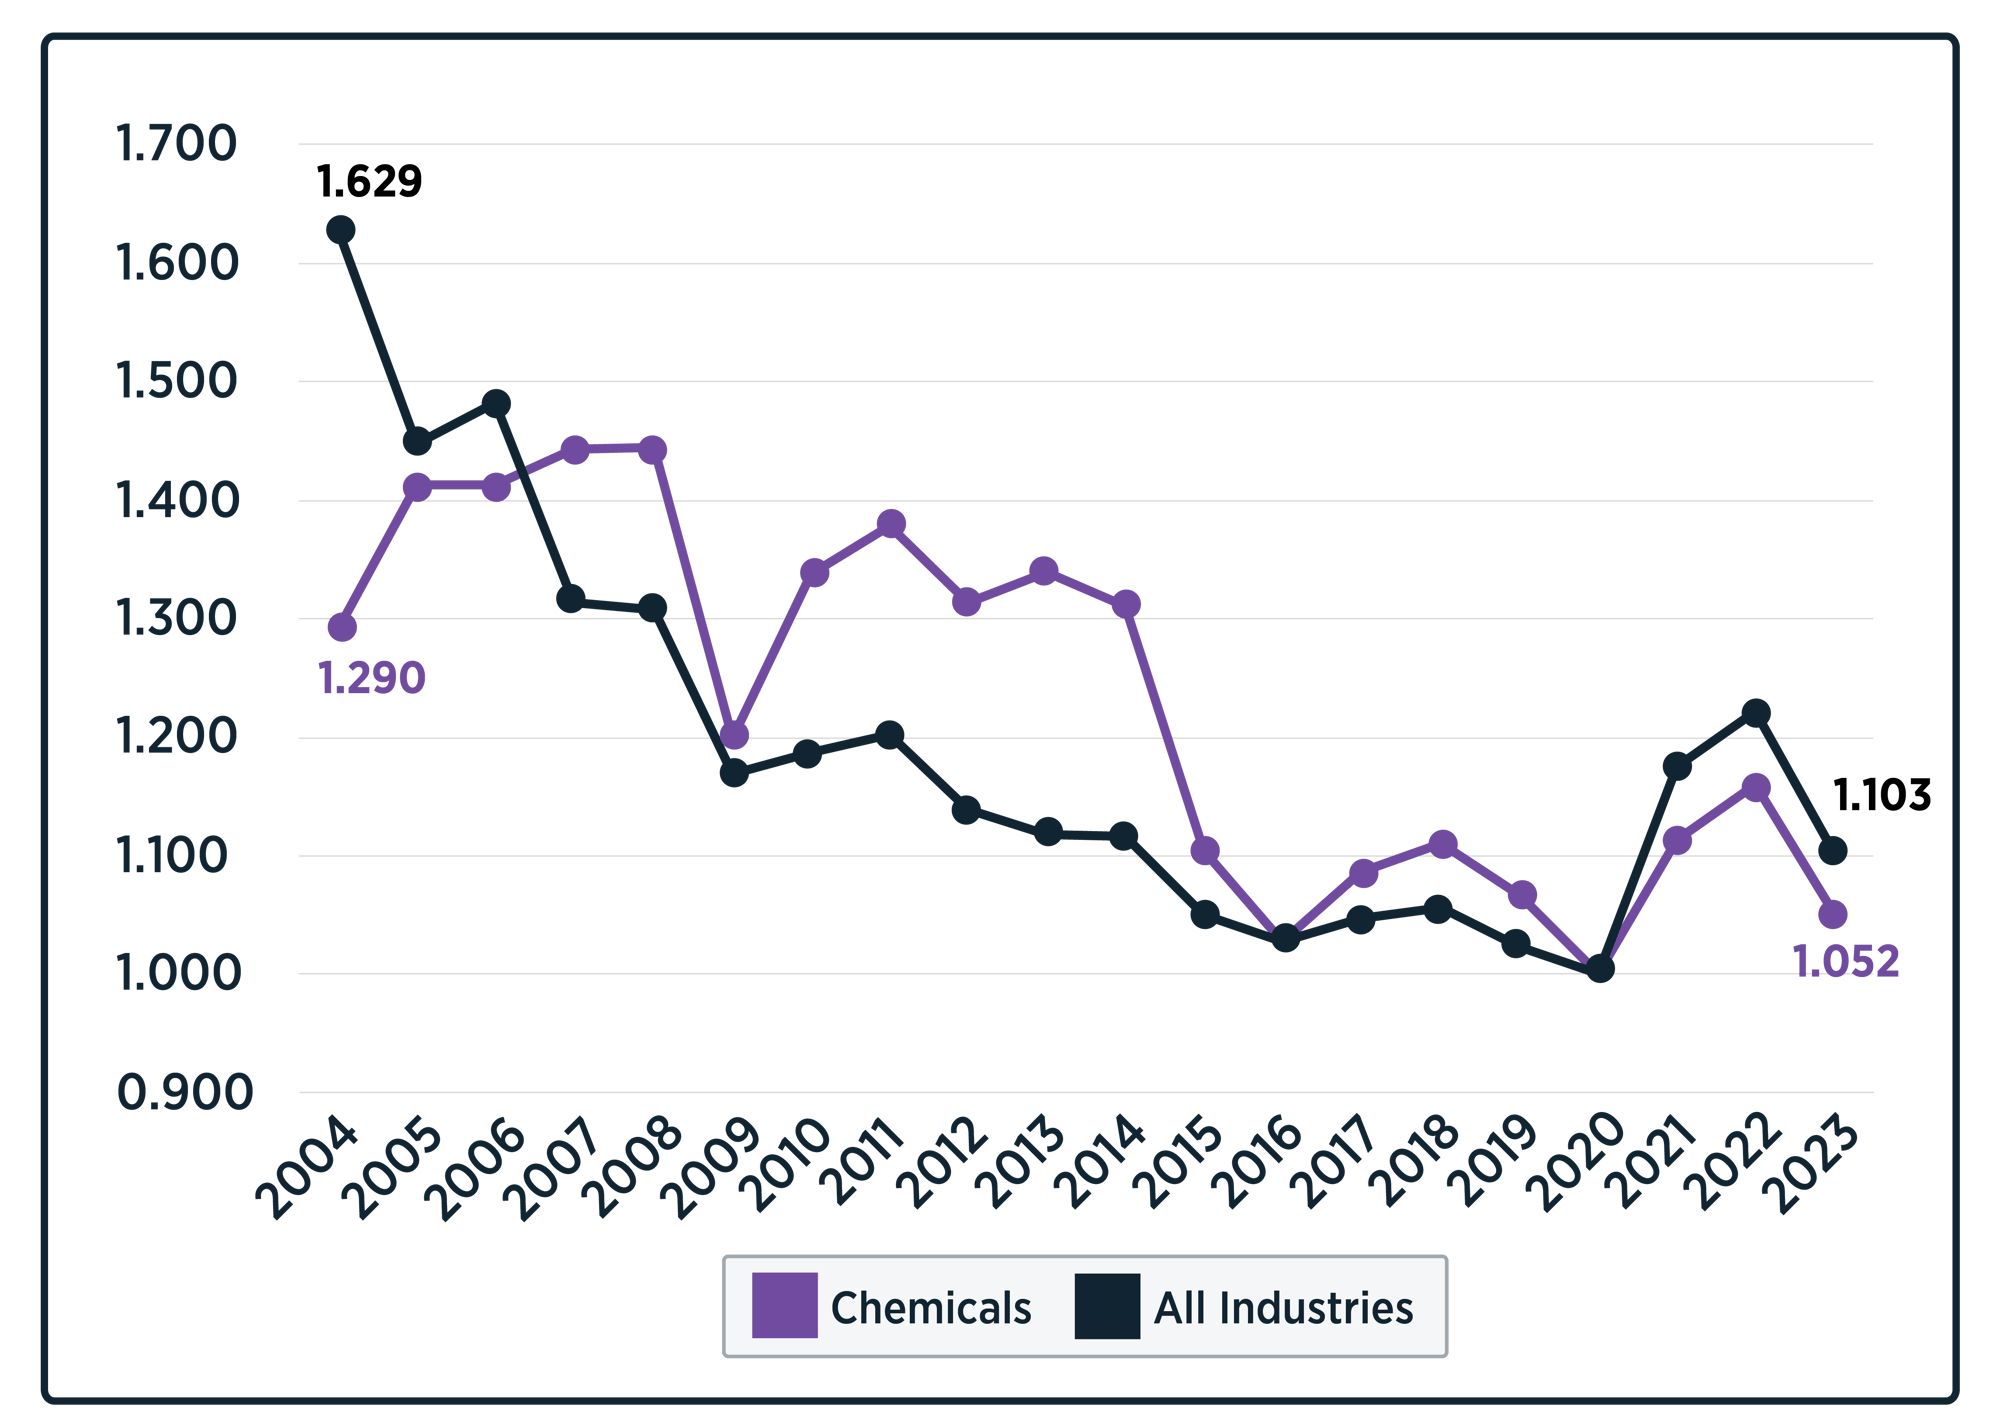
Chemical companies have historically struggled with industrial productivity growth, and those challenges have continued since 2020.
A general lack of new capital investment in the US and Europe, coupled with a developing over-capacity in China for many product categories, has dampened productivity growth across the industry. Additionally, a limited view of Operational Excellence, that is largely focused on just safety and cost, and hasn’t effectively scaled beyond the largest US Chemicals companies like Dow and Dupont has also held back the industry.
However, Pathfinder companies like CF Industries and Ecolab are showing how a holistic approach to quality, safety, productivity, and sustainability, along with entering new markets and being customer-focused, can deliver sustained productivity growth.
Industry Details
Chemicals were organized by product specialization, including basic chemicals, specialty chemicals, agrichemicals, and industrial applications, like water treatment and coatings: Agrichemicals; Basic and commodity chemicals; Industrial gases; Paint and coatings; Specialty chemicals (plastics materials and resin, miscellaneous, etc.); and Water treatment. Twenty-six companies were included in the Chemicals Index.
Key Industry Productivity Statistics
- The Chemical Industry Productivity trendline is a negative curve compared to the IPI curve overall. The industry had a 15.9% decline in productivity over the last 20 years.
- The Chemical industry realized a COVID Productivity bump with 15.6% productivity growth from 2020 to 2022.
- Like most other industries, the Chemical Industry regressed from 2022 to 2024 with negative 11.8% productivity growth.
- Last year, the Chemical Industry was one of the only industries to improve, recording a 4.6% productivity growth.
- 69% of companies had negative productivity growth from 2021 to 2024 (though 2021 was a strong year).
- 18 of 26 companies had negative productivity growth last year.
Consumer Products .svg)
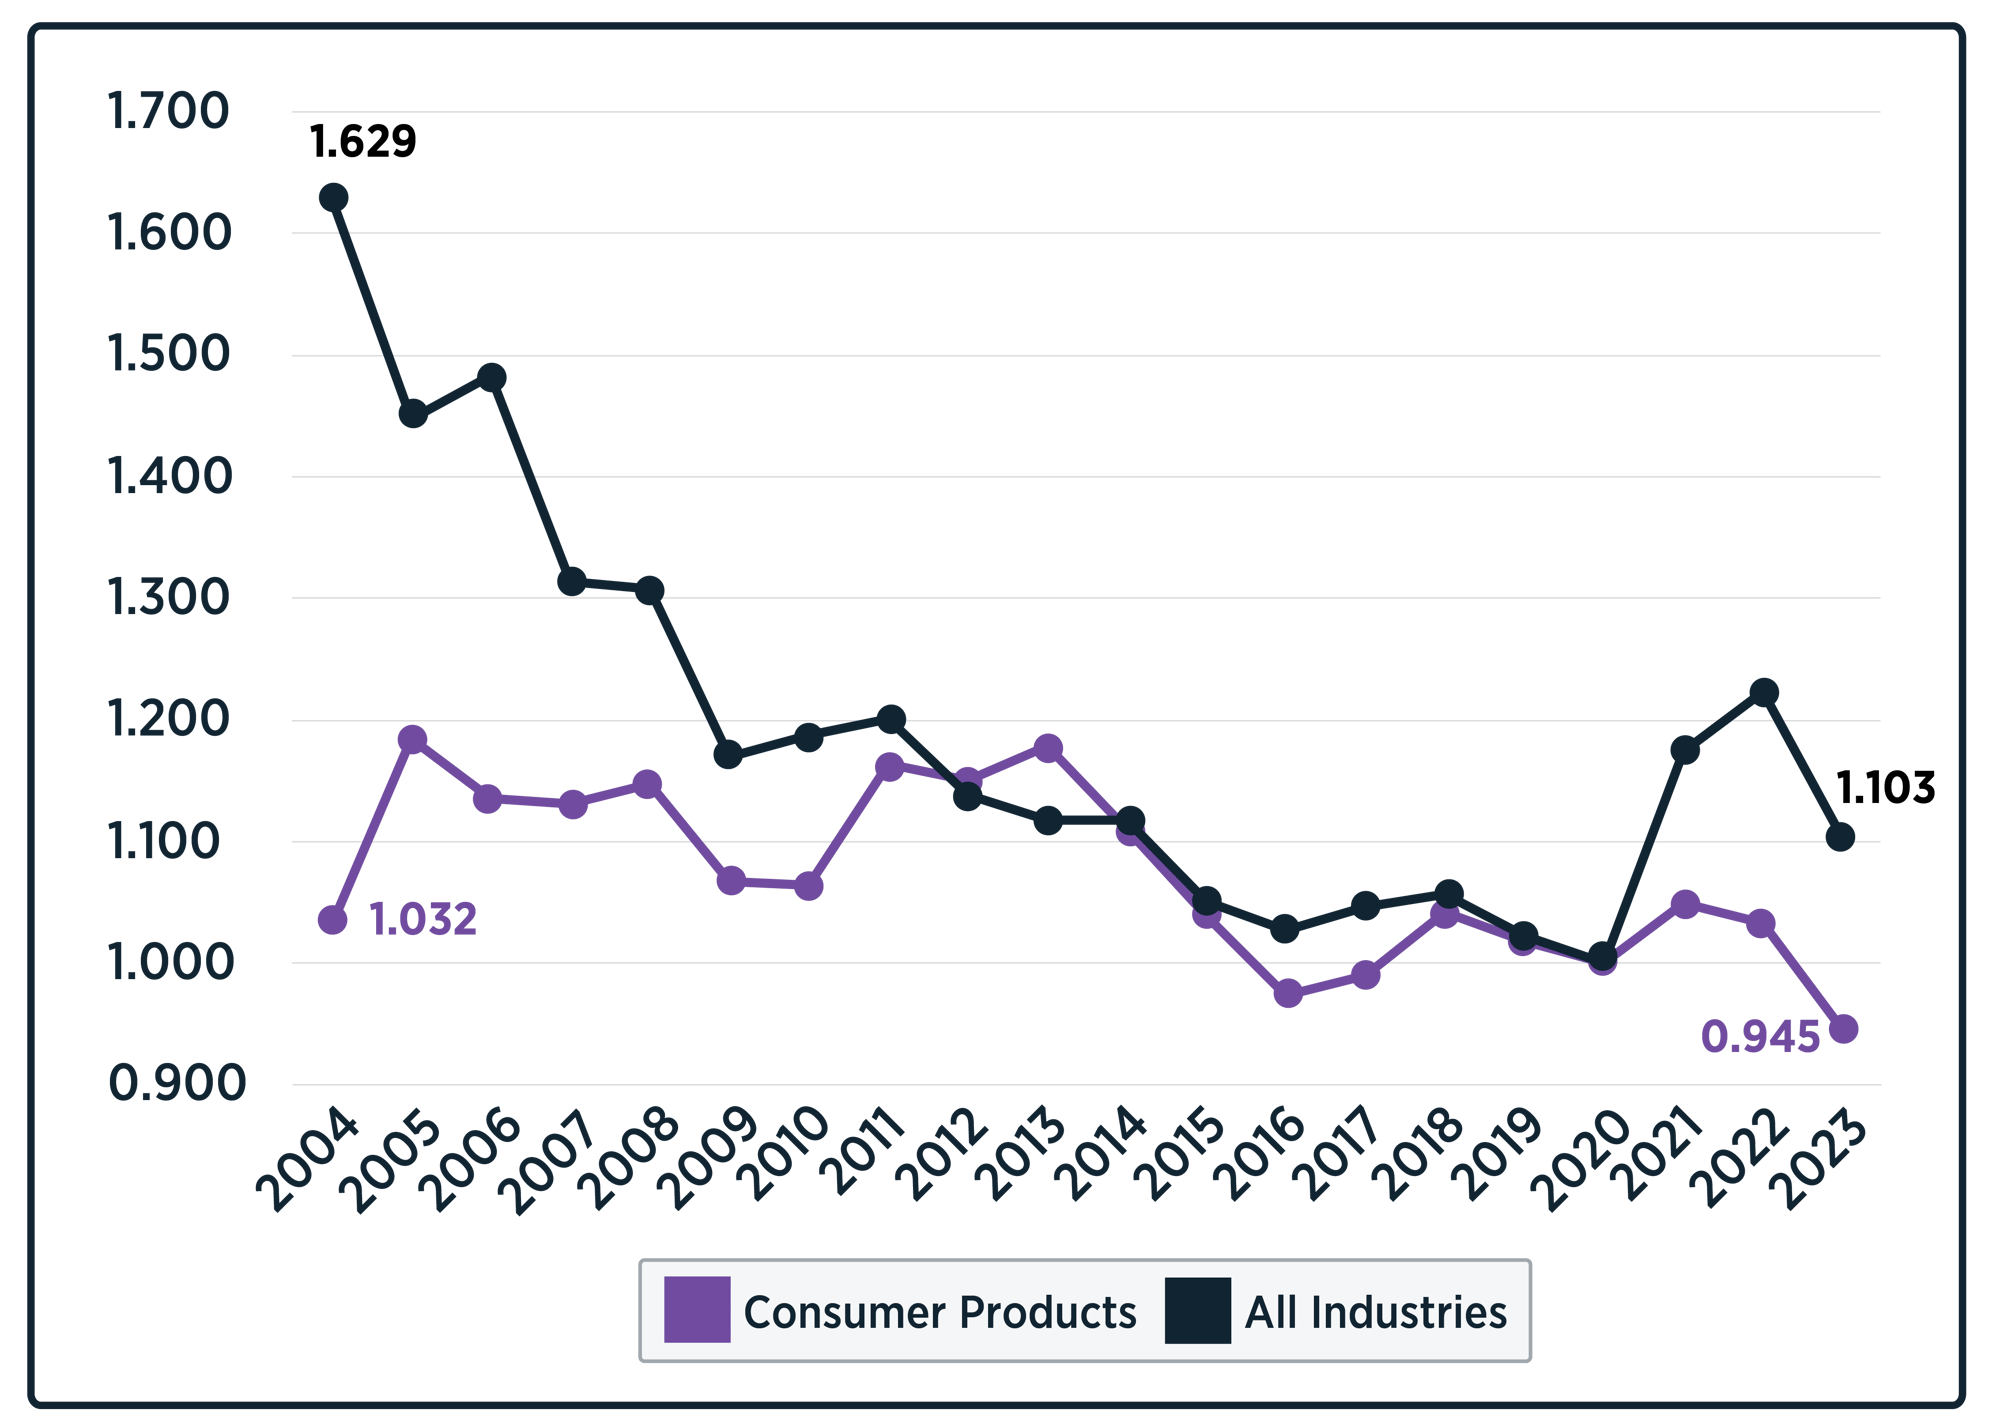
Consumer Products companies have traditionally been in the middle of the pack for industrial productivity growth but have struggled since 2020, with the second worst performance of any industry.
Typically, more focused on brands and supply chains than manufacturing, the industry has seen an increase in outsourced manufacturing over the past decades, but has not reaped the same productivity benefits as F&B and high-tech.
Further, some of the outdoor and alcohol brand companies that saw significant benefits coming out of COVID19 have not been able to sustain the gains post 2022.
Finally, some high-profile, high-margin companies like P&G are not just brand companies but have invested heavily in R&D and innovated new operating models like the Integrated Work Systems (IWS). However, others in the industry that have adopted IWS have not been as successful as companies in other industries that have been more likely to adopt TPS principles.
For future success, look towards European Pathfinders forging their own way through an integration of new operating models and Industry 4.0 technologies like stalwarts Beiersdorf and Reckitt.
Industry Details
The consumer products sector was based on product type, focusing on durable goods, sporting goods, fast-moving consumer goods, including personal care and tobacco products: consumer durable goods, home and personal care, sporting goods, and tobacco. Twenty-nine companies were included in the Consumer Product Index.
Key Industry Productivity Statistics:
- The Consumer Products Industry Productivity trendline is a flatter curve than the IPI curve overall. The industry had “only” an 8.3% decline in productivity over the last 20 years. The eclectic nature of this industry made a wide variation in productivity growth between companies almost inevitable.
- ·The Consumer Products Industry realized a smaller-than-average COVID Productivity bump, with 3.9% Productivity growth from 2020 to 2022.
- Like most other industries, the Consumer Products Industry regressed from 2022 to 2024 with negative 8.7% Productivity growth (though 2021 was a strong year generally).
- Last year, the industry reverted to the mean and recorded flat productivity growth.
- 66% of Consumer Products Companies regressed in productivity over the last three years.
- 16 of 26 Consumer Product companies in the Index had negative productivity growth last year.
Energy .svg)
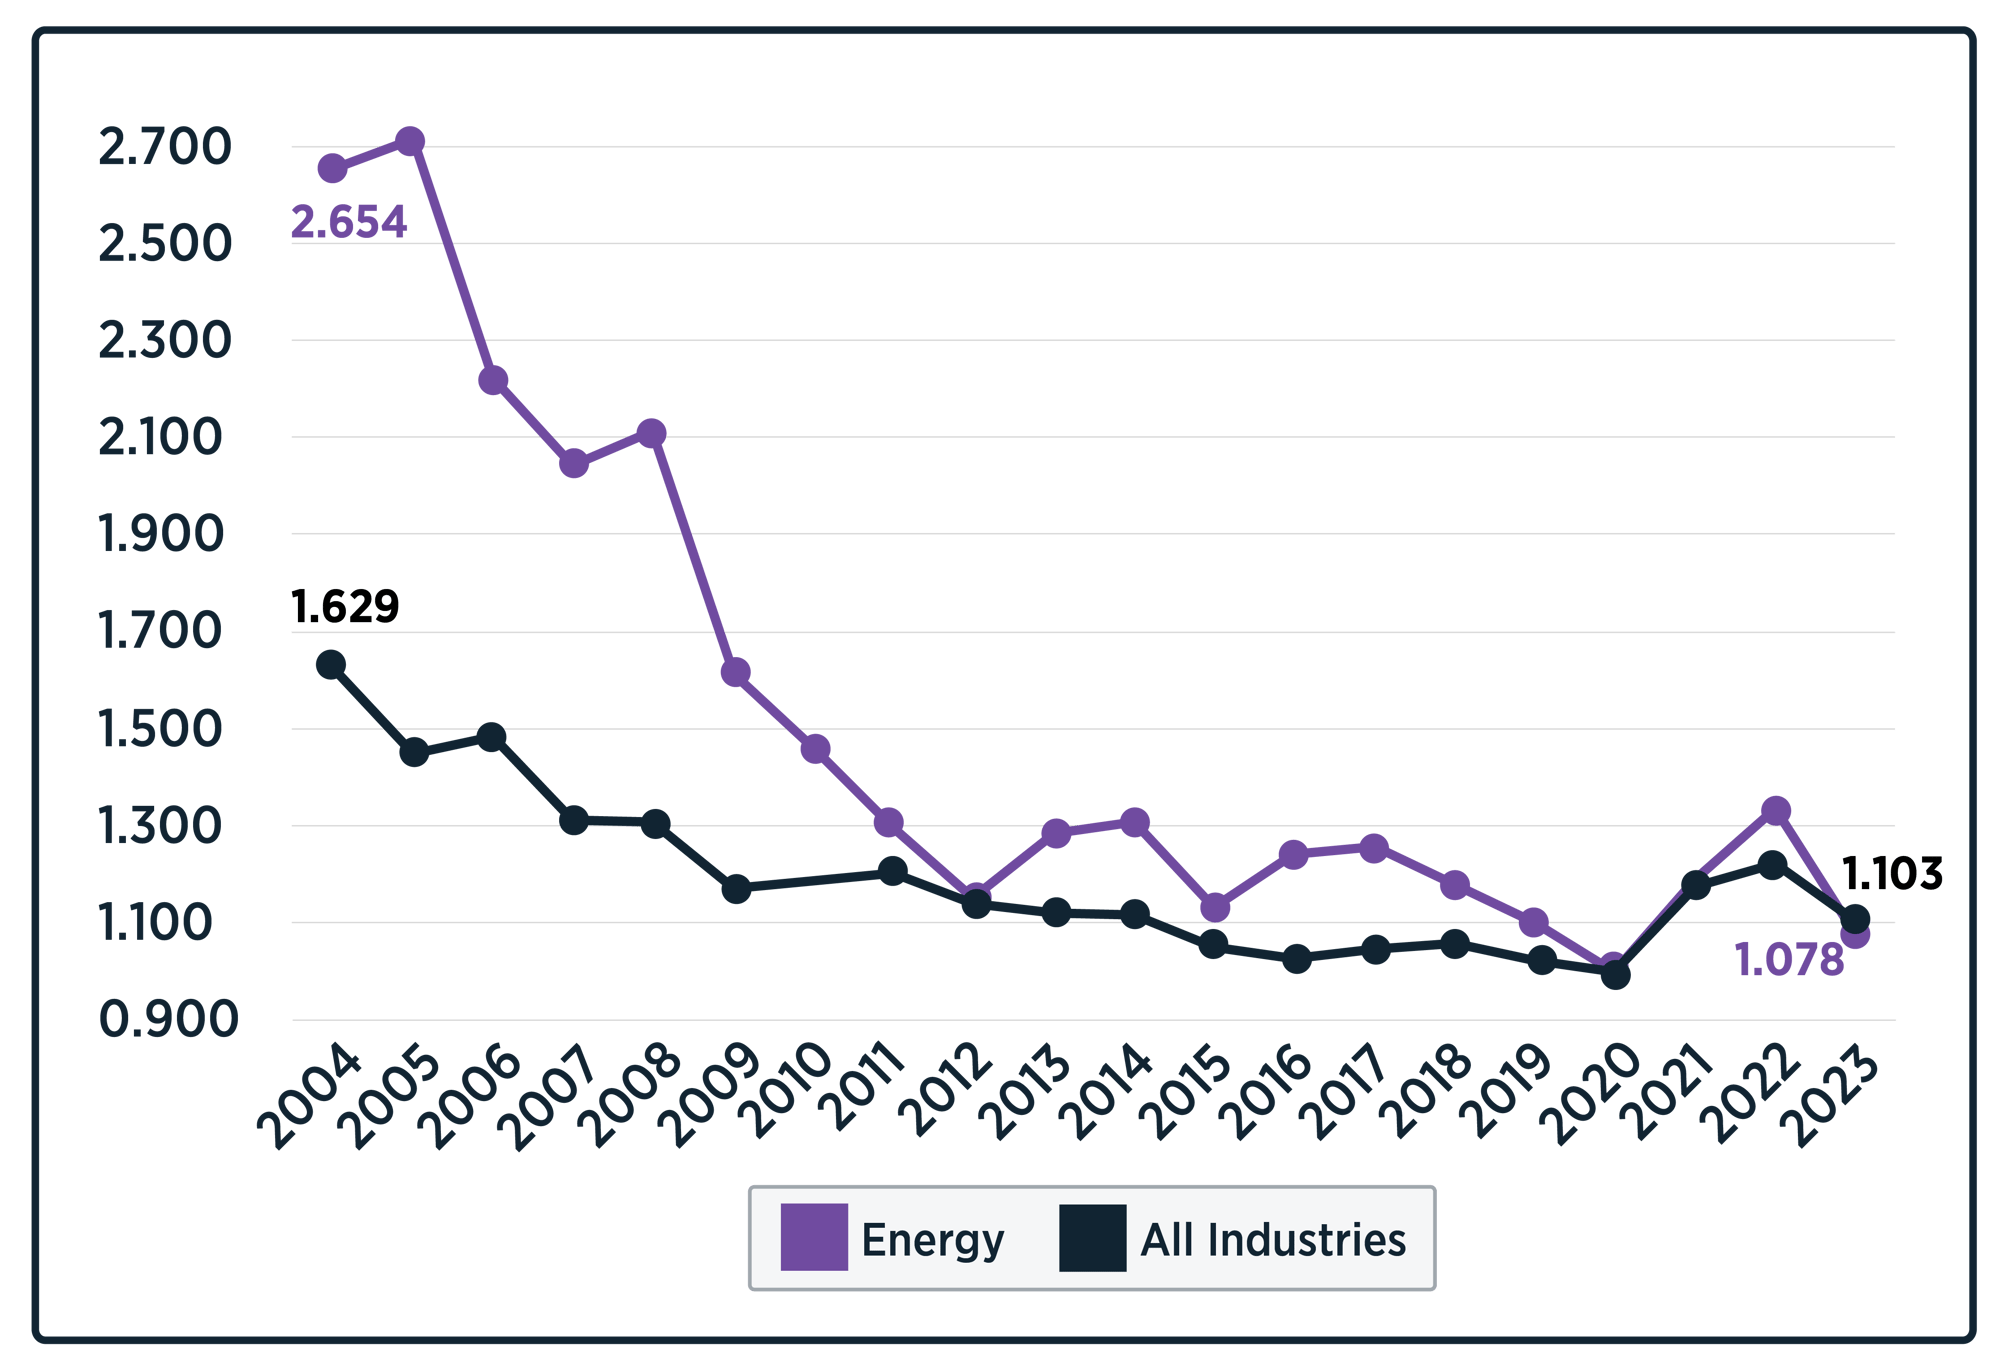
Energy companies have been the worst industrial productivity performers over the past two decades, significantly pulling down the overall index. Since 2020, they have fared somewhat better, but a lack of capital investment in the US and Europe, struggles to recruit new talent, a restrictive regulatory regime, and a focus on the return of shareholder profits at the expense of productivity growth have all served as headwinds.
Many current Pathfinders have benefited from recent green energy investments and tax credits, which are now under attack from consumers and politicians. In the coming years, focused refiners like ConocoPhillips may be the industry's sweet spot.
Industry Details
The Energy industry was divided by energy sources (coal, oil, natural gas) and the value chain, including upstream, midstream, and downstream oil operations and electric power generation: coal, electric power, natural gas, and oil and gas (extraction, transportation, refineries). The Energy Index included 30 companies.
Key Industry Productivity Statistics
- The Energy industry has been by far the worst performer when compared to other industries and is a clear drag on the overall Index. The industry delivered 59.2% negative productivity growth from 2004 to 2024. The vertical is the prototypical example of being profitable and unproductive.
- Echoing the overall Index, Productivity declines in the Energy industry began to flatten from 2016 to 2020, and in fact showed a significant 33.3% Productivity growth from 2020 to 2022 (the COVID years).
- Like most other industries, the Energy Industry regressed from 2022 to 2024 with negative 18.5% Productivity growth (though 2021 was a strong year generally).
- Last year the Energy Industry was one of only two industries (along with High-tech) with Productivity Growth. The industry delivered 1% year-over-year productivity growth.
- 57% of companies had negative productivity growth from 2021 to 2024 (though 2021 was a strong year).
- 14 of 30 companies had positive productivity growth last year.
Food & Beverage .svg)
Food and Beverage companies are one of three industries that have actually grown industrial productivity over the past 20 years.
The industry is notoriously low-margin and labor-intensive. It has a significant historical focus on operational excellence, which has paid dividends through approaches like TPM or WCM and metrics like OEE. More recently, because of these factors, the industry has been a leader in adopting Connected Frontline Workforce applications and Smart Manufacturing approaches.
The industry has also adopted an outsourced manufacturing approach through co-packers that drives suppliers to differentiate in their ability to drive innovation through NPI, sustainable cost savings, and productivity improvements.
LNS Research expects this industry to be a continued source of innovation and performance improvement, led by Pathfinders like Kraft-Heinz and AB InBev.

Industry Details
Categories in this industry were based on product type, with a split between alcoholic and non-alcoholic beverages, agricultural products, and a range of packaged foods like snacks, dairy, and confectionery. Several of the packaged food companies had different levels of vertical integration, which was accounted for, in addition to product type mixes: Agricultural commodities and products, beverages, ingredients and flavors, and packaged (cereal, confectionery, dairy, etc.). Thirty-six companies are included in the Food and Beverage Index.
Key Industry Productivity Statistics
- The Food and Beverage Industry Productivity trendline is a more positive curve than the IPI curve overall. The industry had a 4.5% growth in productivity over the last 20 years.
- The Food and Beverage industry realized only a modest COVID Productivity bump with 15% Productivity growth from 2020 to 2022.
- Like most other industries, the Food & Beverage Industry regressed from 2022 to 2024 with negative 11.3% Productivity growth (though 2021 was a strong year generally).
- Last year, the Food and Beverage Industry regressed, recording a 3.7% productivity decline.
- 83% of companies had negative productivity growth from 2021 to 2024 (though 2021 was a strong year).
- 15 of 36 companies had negative productivity growth last year.
High-tech .svg)
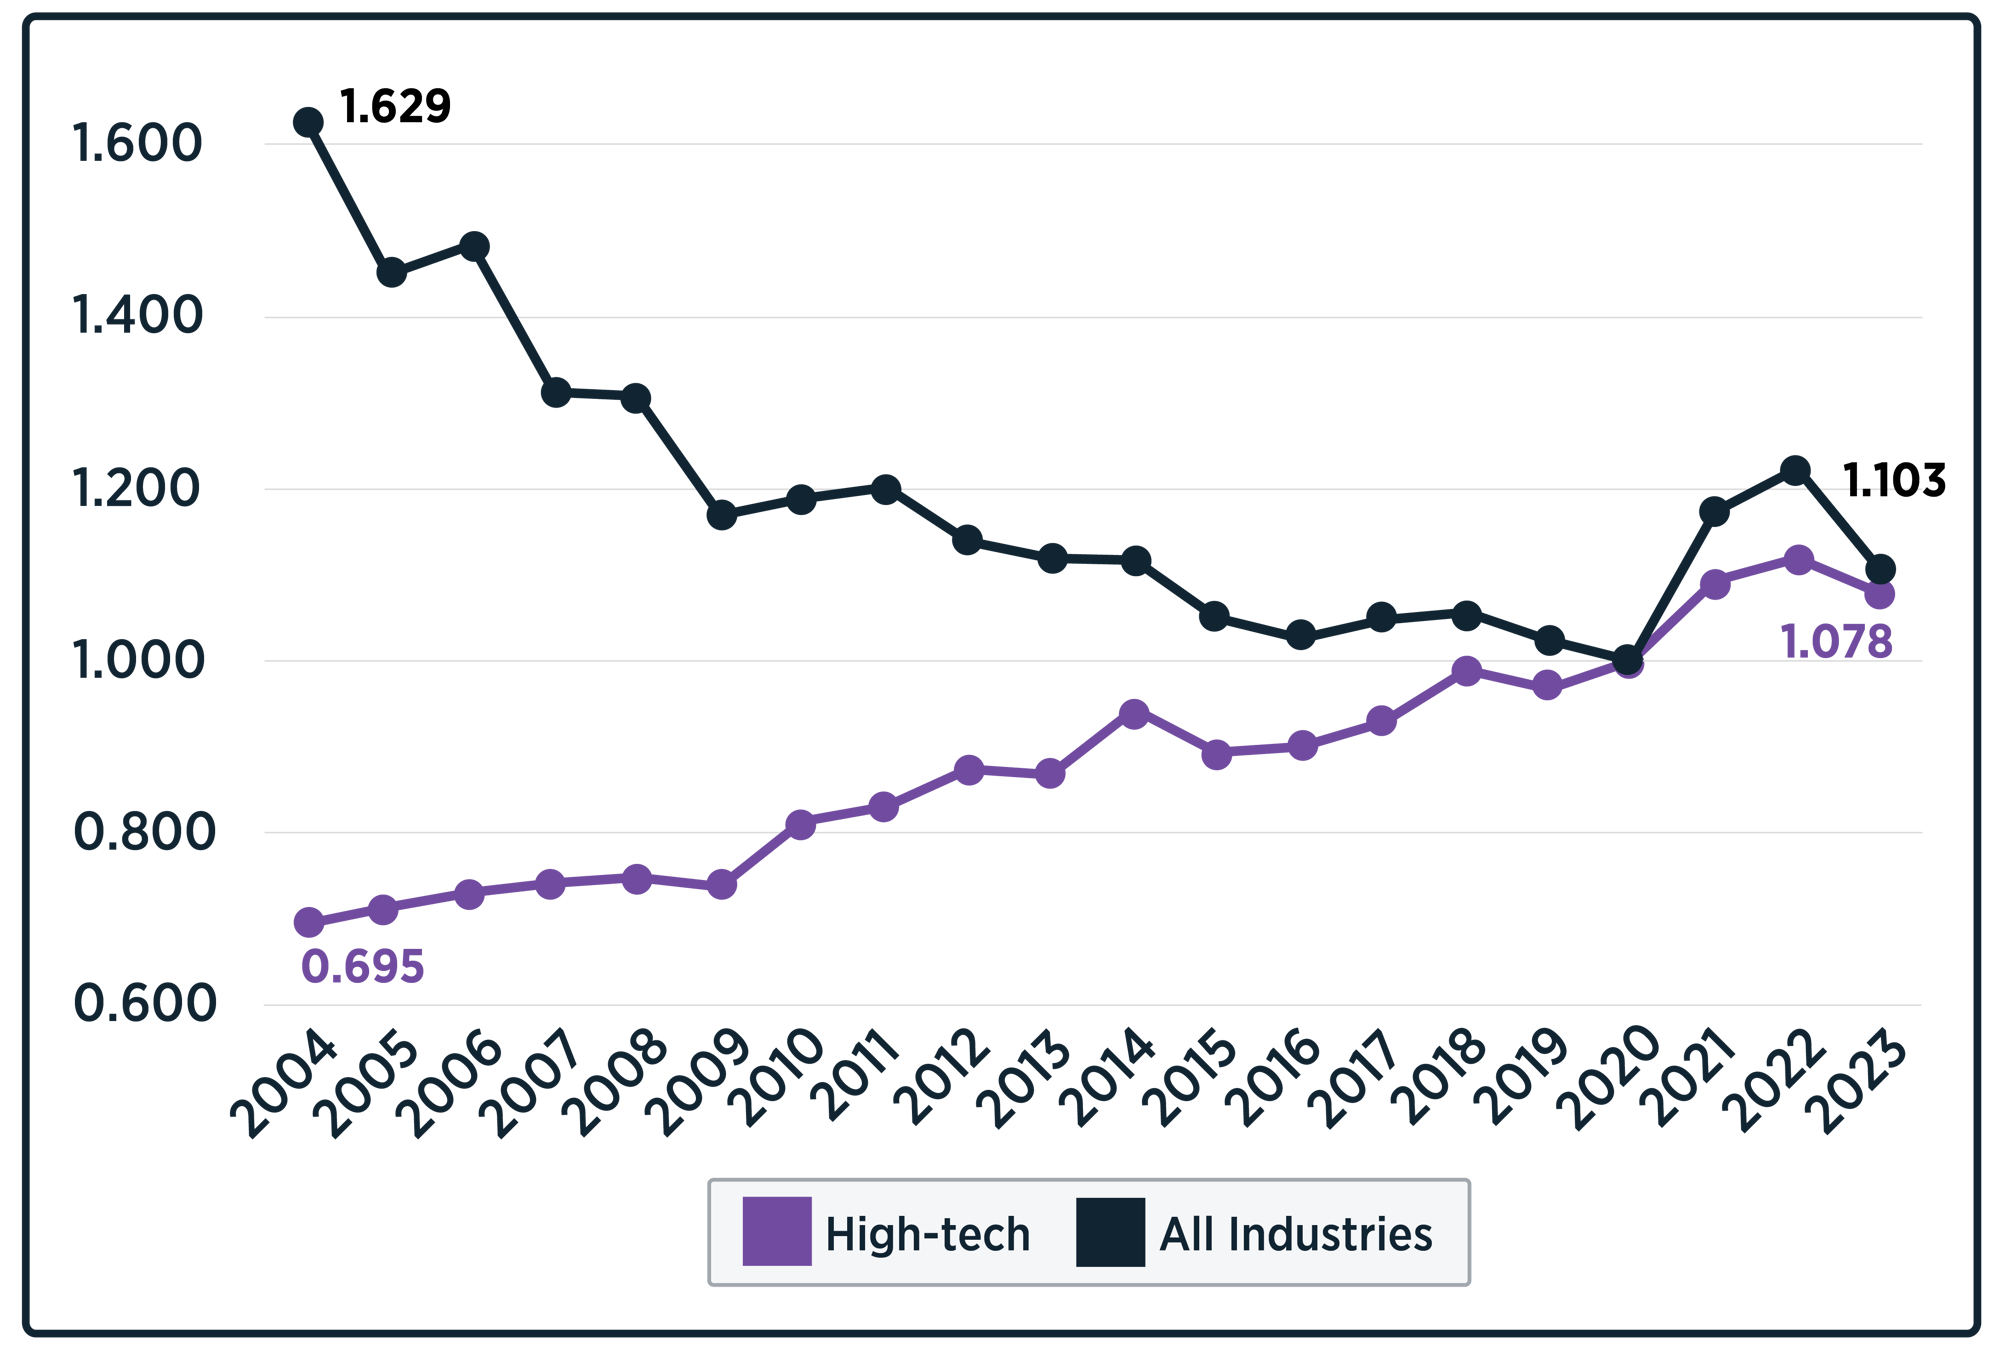
High-tech companies are industrial productivity growth machines, no industry has done better over the past 20 years.
Having moved a decade (or more) beyond outsourced, low-cost-labor arbitrage models, high tech companies are investing more capital in manufacturing capabilities than any other industry. And these investments are highly automated, coupled with Industrial AI capabilities, and tight integration between engineering, manufacturing, and supply chain capabilities.
Top performers in include EMS vendors like Celestica, Kimball Electronics, and Foxconn along with semiconductor companies like TMSC and equipment manufacturers like HP.
The industry's only shortcoming may be that many EMS vendors lack competitive differentiation, but overall, not enough companies look to high-tech manufacturing as a source of inspiration and best practices.
Industry Details
The sub-industries were divided between equipment manufacturing, including computing and connectivity equipment, and component production (solar panels). We also accounted for differences between semiconductor fabs and electronic manufacturing services (EMS) companies: Connectivity equipment; Personal computing equipment; Semiconductor chips and printed circuit boards assembly; and Solar panels. Twenty-eight companies were included in the High-tech Index.
Key Industry Productivity Statistics
- The High-tech Industry was one of two industries (along with Automotive) that demonstrated Productivity growth over the last 20 years. In fact, High-tech was the industry with the greatest productivity growth over the last 20 years. The industry grew productivity by 37.1% from 2004 to 2024. It is fair to say that High Tech and Automotive hid the real scale of the Productivity Crisis by offsetting much of the decline across the other industries.
- High-tech differed from most other industries in that there was little COVID “bounce”: productivity grew only 9.6% from 2020 to 2022.
- The High-tech industry, therefore, did not see the post-COVID regression that plagued most other industries. The industry grew in productivity by 5.4% from 2022 to 2024.
- Last year the High-tech Industry was again one of only two industries (along with Energy) that demonstrated productivity growth. The industry delivered 4.0% year-over-year productivity growth.
- “Only” 29% of High-tech Companies regressed in productivity over the last three years (the fewest of any of 10 industries).
- Only 8 of 28 companies had negative productivity growth last year.
Industrial Equipment .svg)
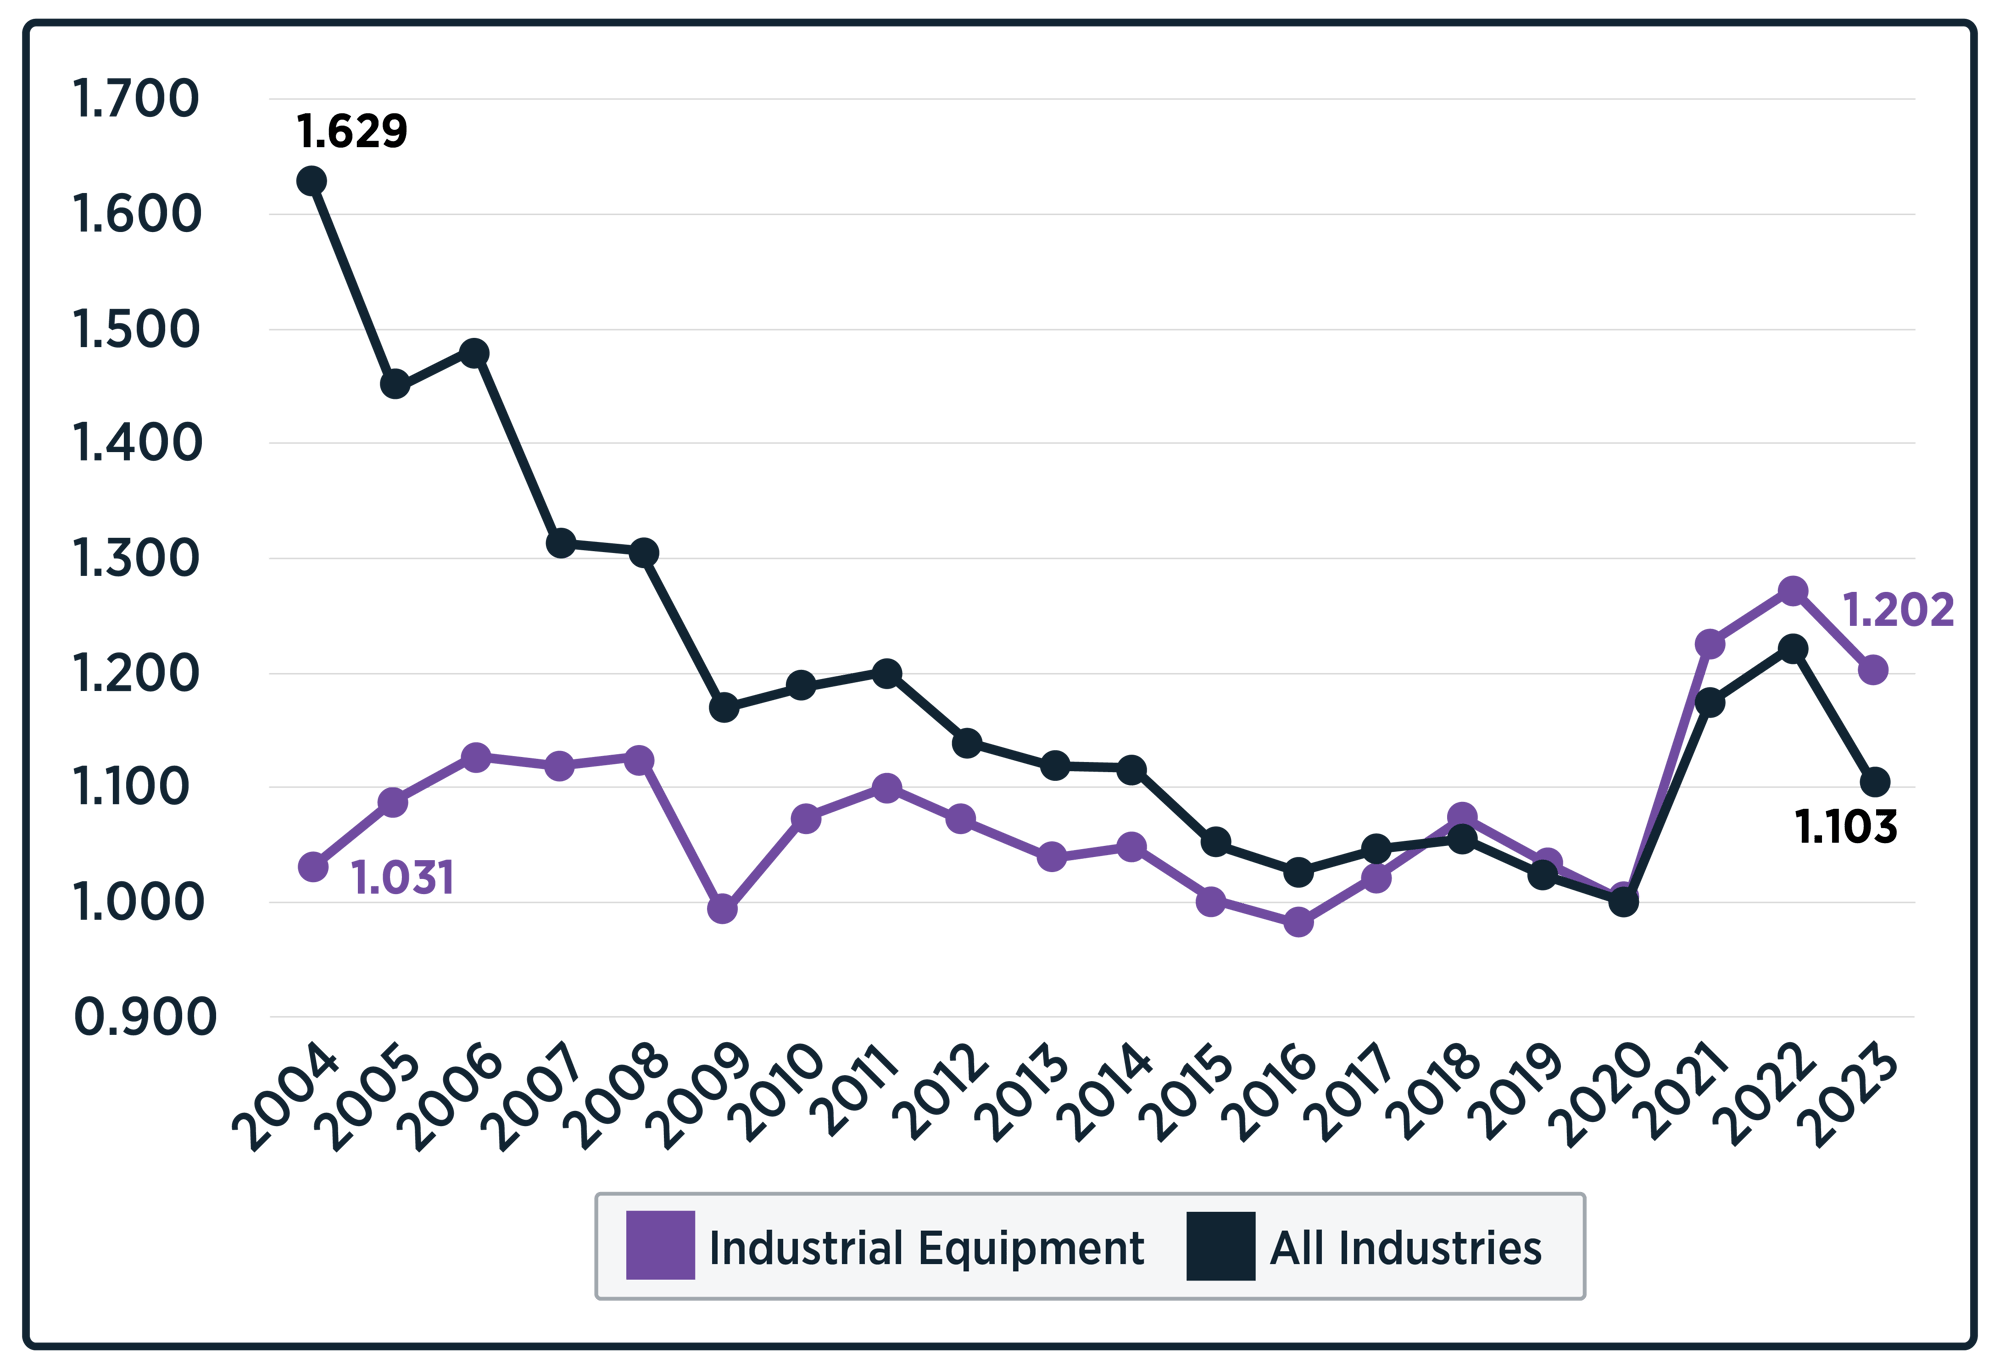
Industrial Equipment manufacturers have been middle of the pack regarding industrial productivity growth over the long-term and short-term.
Many of the largest and most recognizable industrial conglomerates in the space have recognized this underperformance and are addressing it by becoming more focused and nimbler; examples include GE, Emerson, Siemens, and Honeywell, among many others.
The best-performing companies have combined specialized equipment with value-added services and outcome-driven business models - think oil field services companies like SLB and Halliburton. Look to more innovations in this sector, from companies combining AI, manufacturing, and service capabilities to deliver differentiated performance.
Industry Details
The Industrial equipment sector was grouped by equipment type, covering areas such as construction and agricultural machinery, industrial automation, HVAC, power systems, and specialty machinery. This category also includes conglomerates that have businesses sprawling across multiple sectors: Agricultural and construction machinery; Automation and electrical equipment; Elevators and escalators; Fluid power systems; HVAC and refrigeration systems; Industrial Conglomerates; Power generation equipment; Semiconductor equipment; and Specialty machinery and equipment. Forty-six companies were included in the Industrial Equipment Index.
Key Industry Productivity Statistics
- The Industrial Equipment Industry Productivity trendline is a flatter curve than the IPI curve overall. The industry had “only” a 5.2% decline in productivity over the last 20 years.
- The Industrial Equipment Industry realized a notable COVID Productivity bump, with a 28.9% Productivity growth from 2020 to 2022.
- Like most other industries, the Industrial Equipment Industry regressed from 2022 to 2024 with a negative 10.7% Productivity growth (though 2021 was a strong year generally).
- Last year, the industry recorded 2.0% negative productivity growth.
- 89% of Industrial Equipment Companies regressed in productivity over the last three years.
- 38 of 46 Industrial Equipment companies in the Index had negative productivity growth last year.
Life Sciences .svg)
Life Sciences companies have historically struggled with industrial productivity growth. They rely on above-average operating margins and are more concerned with R&D success and regulatory compliance. This has resulted in the second-worst performance of any industry over the past twenty years.
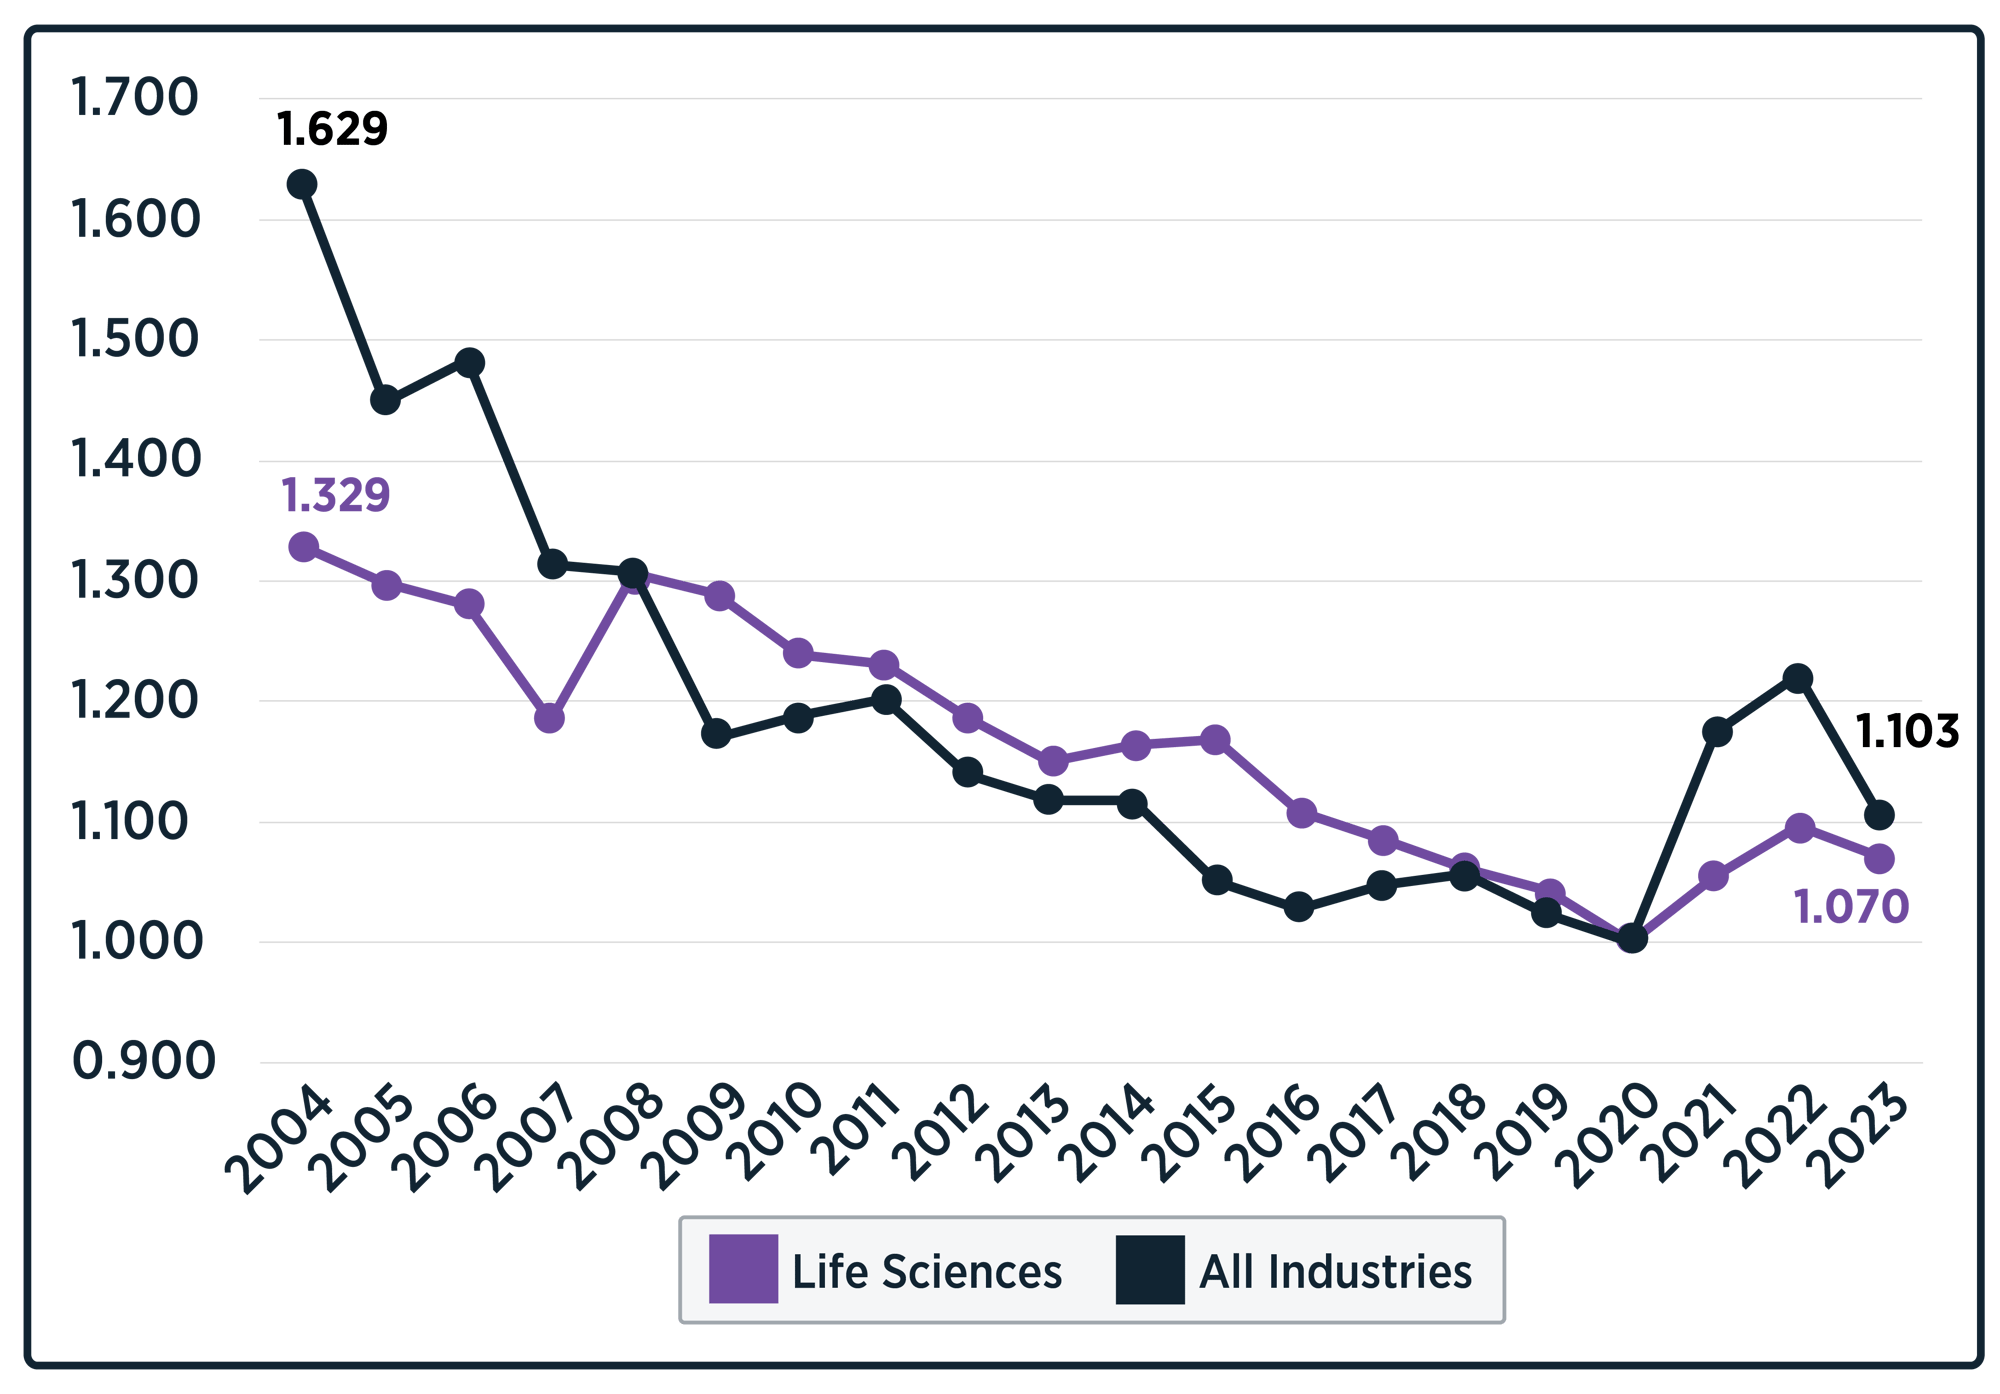
But since 2020, the industry has performed better, coming in the middle of the pack and increasing productivity by about 10%. COVID-19 revealed to many life sciences companies the benefits and possibilities of moving faster and delivering more through improved manufacturing capabilities.
This has resulted in a generational shift in the deployment of new capital expenditures, in the form of new billion-dollar-plus sites, that bring new technology and approaches that extend across the value chain. These tie together R&D through the patient experience, embedding quality and compliance, and enable novel approaches at scale, like cell gene therapy and other personalized medicines.
Look toward Life Sciences companies to continue their improvements, even some of them moving into leadership positions, especially for Pathfinder companies like Danaher, Merck, and Bristol-Myers Squibb.
Industry Details
The Life Sciences industry was split by the type of health and medical focus, including biotech, pharmaceuticals, medical devices, and contract manufacturers. The pharmaceutical industry accounts for pricing differences between specialized pharma companies and the larger, more diversified ones, with scope to further differentiate based on the type of drugs and diseases targeted: Biotech; CDMO and distributors; Medical devices; Pharmaceuticals (diversified across disease areas); and Pharmaceuticals (specialized disease areas). Forty-six companies were included in the Life Sciences Index.
Key Industry Productivity Statistics
- We often think of the Life Sciences Industry as on the leading edge. Yet, the industry has been one of the worst Productivity performers when compared to other industries (along with the Energy Industry). The industry delivered 35.1% negative productivity growth from 2005 to 2024. The highly regulated, validation-constrained nature of manufacturing in Life Sciences may be core to the industry’s Productivity Crisis.
- Like the overall Index and most other industries, Productivity declines flattened in the Life Sciences from 2016 to 2020. Life Sciences saw a notable COVID bounce, growing productivity 15.6% from 2020 to 2022.
- Like most other industries, the Life Sciences Industry again regressed from 2022 to 2024 with negative 5.1% Productivity growth (though 2021 was a strong year generally).
- Last year the industry recorded .05% negative productivity growth.
- 67% of Life Sciences companies had negative productivity growth from 2021 to 2024 (though 2021 was a strong year).
- 28 of 46 Life Sciences companies had negative productivity growth last year.
Materials .svg)
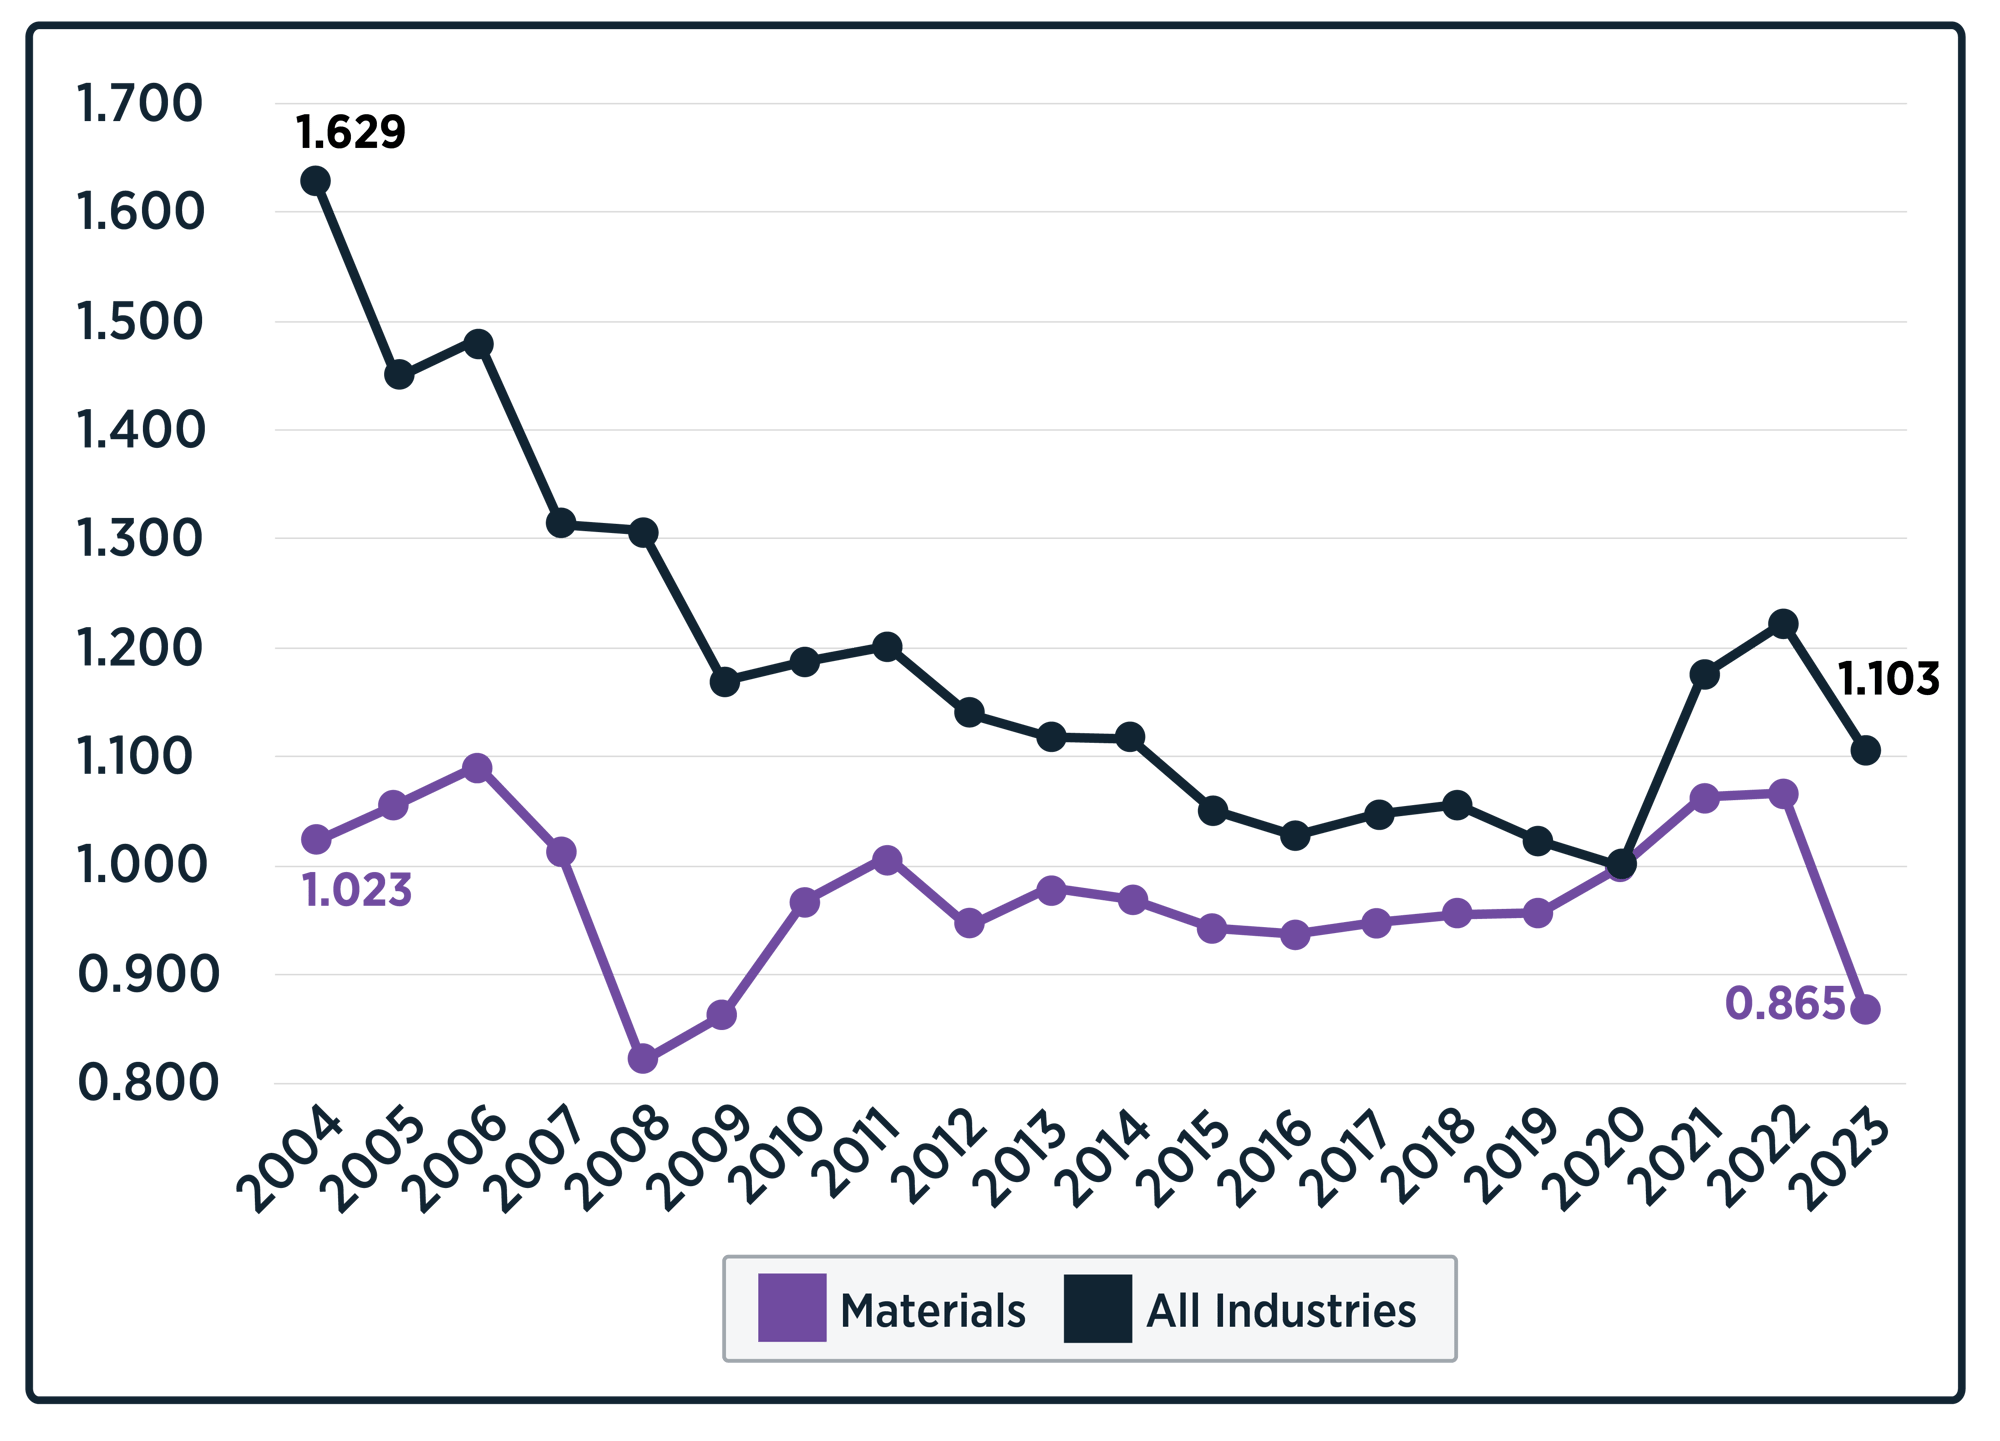
Materials companies have historically struggled with growing industrial productivity. From 2004 to 2024, they delivered the third-worst performance, accounting for a 22% productivity loss.
Unfortunately, the story is even worse if we consider just the post-COVID-19 boom, with materials being the worst-performing industry.
Material companies suffer from many of the same challenges as other process industries: a lack of capital investment, workforce challenges, and a relative lack of investment in operational excellence and operating models. They also face unique challenges, including a boom-and-bust cycle highly dependent on volatile commodity prices and a recent rash of high-profile digital transformation initiatives that failed to deliver results.
However, there are bright spots in the industry, especially in some building products, packaging, and metals companies that are taking on business-led transformations, embracing new operating models, advanced analytics, and virtual operations center approaches.
Industry Details
The diverse materials industry includes an assortment of companies, ranging from metals, mining, and minerals companies that refine, process, and mine metals, accounting for price changes across specific metals like Aluminum, Copper, Gold, Steel, etc. Additionally, the industry also includes several types of building material companies, packaging, and specialty materials that account for price changes based on their products: Building materials (aggregates and construction, home improvement, roofing, etc.); Metals and mining (Aluminum, Copper, Gold, etc.); Packaging (glass, metal, plastic, etc.); and Specialty materials. Sixty-one companies were included in the Materials Index.
Key Industry Productivity Statistics
- The Materials Industry Productivity trendline is a negative curve compared to the IPI curve overall. The industry had “only” a 22.6% decline in productivity over the last 20 years.
- The Materials Industry experienced one of the most muted COVID Productivity bumps, lasting only one year. Its productivity increased 5.7% from 2020 to 2021.
- The Materials Industry regressed significantly from 2021 to 2024 with a negative 22.4% Productivity growth (though 2021 was a strong year generally).
- Last year, the industry had one of the worst years recorded at 14.1% negative productivity growth.
- “Only” 46% of Materials Companies regressed in productivity over the last three years. This was the second lowest percentage across all industries, behind only High-tech.
- 24 of 61 Materials companies in the Index had negative productivity growth last year.
How to Become a Pathfinder
For operational executives interested in understanding what it takes to become a Productivity Pathfinder, LNS Research offers the data, benchmarks, and strategic insights to guide your journey. Schedule a Pathfinder benchmarking call today to explore how you can employ the best practices of Productivity Pathfinders.
Attend An
Event
Engage with senior operations leaders and explore strategies that drive real productivity gains
Read The
Report
Discover the data and insights behind the world’s most productive companies
Book a Pathfinder Benchmarking Call
Benchmark your performance and uncover your biggest opportunities for impact